
A trader can be right about direction, execute the entry perfectly, and still lose money because the profit target was unrealistic.
I have seen this happen repeatedly with day traders. Price breaks a resistance level, momentum accelerates, and the trader immediately starts looking for a 3R or 4R target. The setup looks strong, so the target gets pushed farther away.
Then the price moves precisely one ATR in the anticipated direction, stalls, retraces and then hits the stop.
The research was good, but the market flipped,” the trader says.
Sometimes it did.
But more often the problem was more basic. The aim was set higher than the present volatility and market structure would allow for reason.
This is where ATR multiples become useful.
Average True Range gives you a way to quantify the typical amount of price movement over a selected period. It is not a directional indicator. It tells you about movement, not whether that movement will be bullish or bearish. Fidelity describes ATR as an average of true ranges and notes that shorter ATR periods can be used when the goal is to measure more recent volatility.
For an active trader, that distinction matters.
ATR does not tell you where the price will go.
It helps you judge whether your target is asking the market to make a move that is small, normal, ambitious, or statistically unusual relative to its recent behavior.
The goal of this article is to build a practical ATR multiples profit target framework that combines volatility with market structure, reward-to-risk, session behavior, and actual trade data.
What an ATR Multiple Profit Target Actually Means
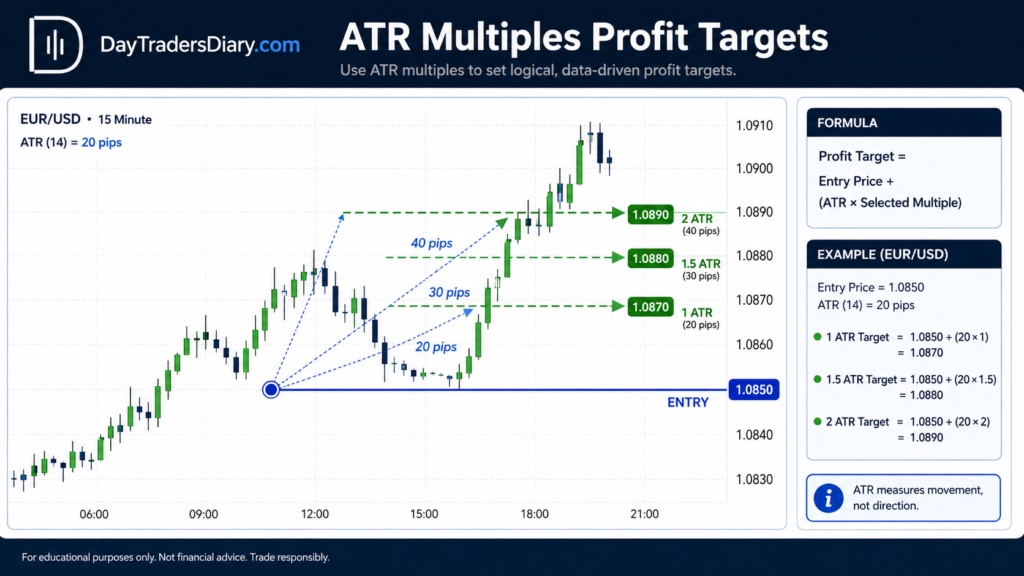
Suppose EUR/USD is trading at 1.0850 and the ATR on your chosen intraday timeframe is 20 pips.
A 1 ATR target means approximately 20 pips.
A 1.5 ATR target means approximately 30 pips.
A 2 ATR target means approximately 40 pips.
For a long trade entered at 1.0850:
1 ATR target = 1.0870
1.5 ATR target = 1.0880
2 ATR target = 1.0890
The mathematics is simple.
The trading decision is not.
The important question is:
Which ATR multiple is appropriate for this particular setup?
A 2 ATR target might be reasonable after a volatility expansion and clean breakout.
It might be unrealistic within a quiet range.
That is the part most basic ATR explanations miss.
ATR Measures Movement, Not Direction
This is the first rule you need to remember.
A rising ATR does not mean the market is bullish.
A falling ATR does not mean the market is bearish.
Fidelity specifically notes that ATR is non-directional. Expanding ATR can accompany either buying or selling pressure.
If EUR/USD has a 20-pip ATR, you cannot conclude that the price is likely to rise 20 pips.
You can only say that the recent price movement has been producing a certain level of range.
Direction must come from your actual trading thesis.
The ATR then helps answer a different question:
How much movement should I expect if my thesis is correct?
That distinction makes ATR much more useful.
Why Fixed Profit Targets Break Down
Suppose you always target 30 pips.
That sounds disciplined.
But consider three different environments.
During a quiet Asian session, 30 pips might represent more than a typical intraday move.
During the London session, 30 pips might be completely ordinary.
During a major U.S. economic release, 30 pips might occur within seconds.
The target is identical.
The market environment is not.
This is the weakness of fixed pip targets.
A fixed target ignores the changing distribution of price movement.
ATR provides a way to make the target responsive to that changing environment.
Charles Schwab describes ATR as a backward-looking measure of average price volatility and notes that traders can use it to establish stop and limit levels.
For a day trader, that means the target can be tied to the market’s current movement rather than selected purely because “30 pips usually works.”
The Research Behind ATR
ATR was developed as a volatility measure rather than a forecasting system. Modern educational material from Fidelity continues to describe it primarily as a measure of volatility, with applications including stops and entry triggers.
Schwab similarly explains that ATR can help traders account for changing volatility when planning stops and limits, particularly because fixed price distances do not adapt to changes in market movement.
The important practical takeaway is not that ATR magically predicts targets.
It is this:
Volatility should influence the distance you expect the price to travel.
CFI also points out that ATR can be calculated over intraday periods and that higher ATR readings indicate greater price volatility, while lower readings indicate quieter movement.
That gives day traders a useful framework.
You can calculate ATR on the timeframe relevant to the trade rather than unthinkingly using the daily ATR.
The First Decision: Which ATR Should You Use?
This is one of the most important choices in the entire method.
If you are trading a five-minute setup, consider using a 14-period five-minute ATR.
If you are trading a 15-minute setup, consider using a 14-period 15-minute ATR.
But there is another approach that can be even more useful.
Use one ATR to understand execution-time volatility and another to understand broader volatility context.
For example:
The five-minute ATR tells you how much the price is moving around your entry.
The one-hour ATR tells you whether the broader market is unusually quiet or active.
You do not necessarily need both in every trade.
But comparing them can prevent a common mistake: using a single volatility number without understanding the environment in which it was generated.
ATR Period Is a Trading Decision
The popular ATR(14) is not a market law.
Fidelity notes that shorter periods, such as 2 to 10, can be used to measure recent volatility, while longer periods, such as 20 to 50, can be used to measure longer-term volatility.
This creates an interesting choice for day traders.
A shorter ATR responds faster.
A longer ATR is smoother.
Suppose a major news release suddenly causes five-minute ranges to explode.
ATR(5) will respond much faster than ATR(20).
That can be useful if your target needs to reflect current conditions.
But it can also become unstable.
One or two unusually large candles can dramatically change a short ATR.
So the right question is not:
“What is the best ATR setting?”
It is:
“How quickly do I want my volatility estimate to react?”
A Simple Starting Point
If you are building this method from scratch, start with ATR(14) on your trading timeframe.
Do not optimize the period immediately.
Collect data first.
Once you have enough trades, compare ATR(5), ATR(10), ATR(14), and ATR(20).
You may discover that your particular strategy benefits from a shorter or longer volatility window.
But make that decision based on evidence.
The Basic ATR Target Formula
For a long trade:
Profit Target = Entry Price + (ATR × Selected Multiple)
For a short trade:
Profit Target = Entry Price − (ATR × Selected Multiple)
Suppose:
Entry = 1.1000
ATR = 18 pips
Target multiple = 1.5
Target distance = 27 pips
Long target = 1.1027
Simple.
But now comes the more important part.
Do not place the target until you check the chart.
ATR Should Set the Distance, Not Override Structure
Suppose your ATR calculation gives you a target of 40 pips.
But there is a big barrier 15 pips above your entry point.
How about setting the target at +40 pips mindlessly?
Probably not.
This is where traders misuse volatility indicators.
ATR tells you how much movement is plausible.
Market structure tells you where opposing order flow may appear.
You need both.
Think of it this way:
ATR tells you, “How much?”
Where? Structure answers
Both ideally should be your aim.
The Structure-Capped ATR Target
Suppose:
Entry = 1.2500
ATR = 20 pips
Target multiple = 2 ATR
Raw target = 40 pips
But significant resistance sits at 1.2528.
That resistance is only 28 pips away.
If you unthinkingly target 1.2540, you are assuming the price will travel through the resistance before giving you your profit.
Maybe it will.
But your probability and execution plan should account for that obstacle.
A more disciplined approach is to recognize 1.2528 as a potential target zone.
This is why I prefer thinking in target zones rather than pretending the market respects one exact ATR number.
ATR Multiple Plus Market Structure
A helpful framework is:
Raw ATR target → find structural hurdles → measure remaining distance → compute resultant R → judge if the trade is still worth it.
This step of last importance.
Say you set your first stop at 20 pips.
Your ATR objective is 40 pips.
That makes 2R.
Resistance is 25 pips distant.
Your realistic first target now is just 25 pips.
Your reward/risk becomes:
25 ÷ 20 = 1.25R
Suddenly the transaction may not be meeting your minimum reward criteria.
The ATR did not fail.
It helped expose a poor trade location.
The Minimum R Filter
This is one of the strongest ways to use ATR multiples.
Before entering, calculate:
Expected reward = distance to realistic target
Then:
R multiple = Expected gain / Initial risk Assume that ATR = 20 pips
ATR multiple selected = 1.5
Target = 30pips Raw
Initial stop = 15 pips.
Possible reward: 30 pips
R=2R
Good.
Resistance is just 21 pips away now.
Your realistic target becomes 21 pips.
R = 21 ÷ 15 = 1.4R.
If your trading plan requires at least 1.5R, you skip the trade.
That is much more useful than entering first and hoping the market reaches the ATR target.
ATR Target Selection Should Depend on Setup Type
There is no reason for every setup to use the same ATR multiple.
Consider a breakout.
A breakout is often designed to capture expansion.
A 1.5 ATR or 2 ATR objective may be reasonable to test.
Now consider a mean-reversion setup.
The market is already extended, and you are trading back toward the middle of the range.
A 2 ATR target may be completely inappropriate.
The target should reflect the expected path of the strategy.
This is where many mechanical systems become fragile.
They apply the same exit to fundamentally different setups.
Breakout Example
Imagine EUR/USD has been compressed inside a 25-pip range.
Five-minute ATR is 10 pips.
Price breaks above resistance.
Your entry is 1.1005.
A 1.5 ATR target gives:
10 × 1.5 = 15 pips.
Target = 1.1020.
That may be reasonable if the breakout is still early.
But suppose ATR begins expanding to 15 pips after the breakout.
Now 1.5 ATR equals 22.5 pips.
The market has demonstrated increased movement.
Your original target may now be conservative.
This introduces an important concept:
Should ATR be measured at entry or updated after entry?
Static Versus Dynamic ATR Targets
The ATR reading at entrance is used for a static target.
You figure the target and leave it alone.
A dynamic target evolves when volatility changes.
Each has its benefits.
A static target is easier to test.
A dynamic target adapts to changing conditions.
But dynamic targets create a serious problem.
Your target can move farther away after you enter.
That can encourage the trader to keep extending expectations because the market is moving.
This is where discipline and rules matter.
Most of the discretionary day traders I work with, I use the ATR reading at entrance as the primary target reference.
If the market then moves drastically, manage the trade with a pre-determined trailing or partial-profit rule rather than continually adjusting the original target.
The “Moving Target” Psychological Trap
Suppose you enter long with a 1.5 ATR target.
The market reaches 1.2 ATR.
ATR expands.
Now 1.5 ATR is farther away.
You tell yourself:
“The volatility has increased, so I should hold.”
Then ATR expands again.
Your target moves again.
You eventually turn a profitable trade into a loss.
This is not volatility adaptation.
It is a target rationalization.
A target should not become a moving finish line simply because you want more profit.
A Better Approach: Initial Target Plus Runner
One of the strongest applications of ATR multiples is combining a fixed initial target with a runner.
Suppose:
Initial risk = 20 pips
ATR = 20 pips
Primary target = 1.5 ATR = 30 pips
That gives 1.5R.
You take partial profit there.
Then leave the remaining position open using a structure or a trailing stop.
Now you have two objectives.
The first captures a statistically reasonable volatility move.
The second gives you exposure to exceptional expansion.
This prevents the common mistake of demanding that every trade become a trend.
Why This Can Improve Psychology
Partial profit is not automatically better.
But it can solve a particular psychological problem.
Many traders have difficulty holding a trade after it reaches a reasonable profit because they fear giving it back.
Others refuse to take profit because they want the full 3R or 4R target.
A structured partial exit creates a middle ground.
You can monetize the expected move while retaining some exposure if the market produces an unusually strong continuation.
The important part is testing the rule.
ATR Multiple Does Not Mean “Expected Maximum Move”
It is worth emphasizing this difference.
If ATR is 20 pips, a 2 ATR target does not imply:
Price generally moves 40 pips.
That indicates you are establishing a target at double the measured average real range.
The actual price distribution can be very different.
Some trades may travel 60 pips.
Others may travel 5.
Some may reverse immediately.
ATR is a reference point, not a probability guarantee.
Use Historical Target Hit Rates
This is where your trading journal becomes extremely valuable.
Suppose you have 200 historical trades.
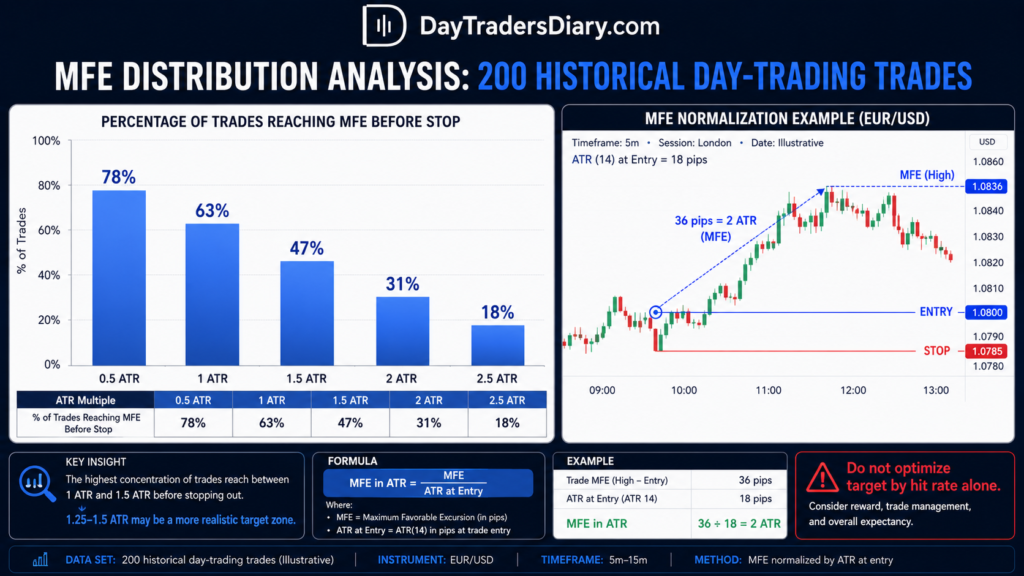
You measure whether the price reached:
0.5 ATR
1 ATR
1.5 ATR
2 ATR
2.5 ATR
before hitting the initial stop.
You might discover:
0.5 ATR reached on 78% of trades.
1 ATR reached on 63%.
1.5 ATR reached on 47%.
2 ATR reached on 31%.
2.5 ATR reached on 18%.
Now you have something useful.
You can evaluate the relationship between target distance and hit frequency.
But Hit Rate Alone Is Not Enough
Suppose 1 ATR gets hit 63% of the time.
It sounds attractive.
But if your average winner at 1 ATR is too small relative to your losses, the strategy may still have poor expectancy.
You need to calculate:
Expectancy = (Win Rate × Average Win) − (Loss Rate × Average Loss)
Imagine your 1 ATR target produces:
63% winners
Average win = 1R
37% losers
Average loss = 1R
Expectancy:
0.63 − 0.37 = +0.26R
Now your 1.5 ATR target produces:
47% winners
Average win = 1.5R
53% losers
Average loss = 1R
Expectancy:
0.705 − 0.53 = +0.175R
The higher target has a lower expectancy despite offering more profit per winner.
This is why target optimization cannot be based on hit rate alone.
The Target Distribution Is More Important Than the Target Number
Instead of asking:
“What ATR multiple should I use?”
Ask:
“How does my strategy distribute outcomes relative to ATR?”
This is a much more powerful question.
You may discover that your setup reaches 0.8 ATR but rarely reaches 2 ATR.
That tells you something about the strategy’s natural behavior.
It may be a mean-reversion system.
Perhaps your entry is late.
The market frequently reaches 1 ATR and then consolidates.
Your stop may be too wide.
The distribution gives you clues.
Measure MFE in ATR Units
This is one of the best ways to research ATR targets.
Instead of recording MFE only in pips, normalize it by ATR.
Suppose a trade’s MFE was 36 pips.
ATR at entry was 18 pips.
MFE in ATR units:
36 ÷ 18 = 2 ATR
Now another trade has an MFE of 50 pips.
But ATR was 25 pips.
MFE:
50 ÷ 25 = 2 ATR
The trades had different pip movements.
But they produced the same volatility-adjusted excursion.
This lets you compare trades across different market environments.
The MFE Distribution Can Reveal Your Best Target
Imagine your data shows that your winners commonly reach:
1 ATR to 1.25 ATR.
A smaller percentage reach:
1.5 to 2 ATR.
Very few reach:
3 ATR.
That tells you your strategy shouldn’t require 3 ATR on every trade.
Instead, target 1.25 or 1.5 ATR and use a runner for exceptional moves.
This is how a trader turns volatility analysis into an actual exit framework.
ATR and Time of Day
ATR changes throughout the trading day.
This is particularly important for intraday traders.
A five-minute ATR calculated during a quiet period may be much smaller than the ATR during a major market overlap.
That means a 1.5 ATR target is not a fixed pip distance.
It expands and contracts with the environment.
This can be an advantage.
But it can also produce poor targets if you ignore session context.
For example, a target calculated based on the current low-volatility environment may be overly conservative immediately before a major session opens.
In contrast, an ATR inflated by a recent news surge creates an unsustainable objective when volatility comes back to normal.
The Volatility Regime Filter
Before using an ATR multiple, classify the current volatility regime.
A simple framework is:
Compressed volatility
ATR is relatively low compared with its recent history.
Normal volatility
ATR is around its normal range.
Expanded volatility
ATR is unusually high.
You can compare the current ATR with its own recent average or percentile.
For example:
Current ATR ÷ 50-period ATR average.
Suppose:
Current ATR = 18 pips
50-period ATR average = 12 pips
Ratio = 1.5.
Current volatility is running at 150% of the longer baseline.
That should influence how aggressively you interpret an ATR target.
Why High ATR Does Not Automatically Mean Bigger Targets
This is another subtle mistake.
A high ATR means the market is moving more.
It does not necessarily mean your trade has more directional edge.
A news event can produce huge two-way volatility.
ATR rises.
But price may simply be whipsawing.
If you increase your profit target just because ATR is high, you could be demanding a large directional move from a market that has become less predictable.
Volatility and opportunity are not the same thing.
This distinction is extremely important.
Combine ATR With Market Structure
I prefer a three-layer target model:
Layer 1: ATR distance
How far is a reasonable volatility-based objective?
Layer 2: Structure
Can you see support, resistance, historical highs, lows, liquidity regions and/or range boundaries?
Layer 3: Reward-to-risk
Does the realistic target provide enough R to justify the trade?
When all three agree, the objective is more of a sure thing.
If they contradict, either lower the trade quality score or skip the setup.
Example of the Three-Layer Model
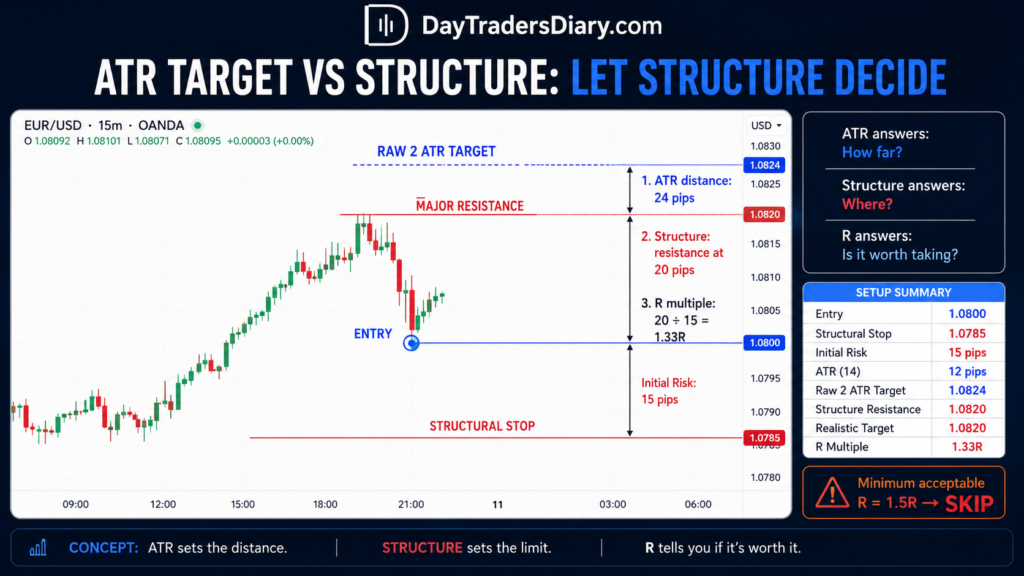
Suppose EUR/USD:
Entry = 1.0800
Initial stop = 1.0785
Risk = 15 pips
ATR = 12 pips
Planned target = 2 ATR
Target distance = 24 pips
Potential reward = 24 pips.
R = 24 ÷ 15 = 1.6R.
Now identify resistance at 1.0820.
That is only 20 pips away.
The structure-capped target gives:
20 ÷ 15 = 1.33R.
If your minimum acceptable R is 1.5R, you skip.
Notice what happened.
The ATR did not tell you to enter.
It helped you evaluate whether the setup had enough room.
The Target Should Be Known Before Entry
One of the worst habits is entering first and calculating the target afterward.
You see a bullish signal.
You buy.
Then you start looking for a target.
This creates confirmation bias.
You may unconsciously choose whichever resistance level produces the R multiple you want.
A better process is:
Identify setup.
Calculate ATR.
Identify structure.
Determine a realistic target.
Calculate R.
Then decide whether the entry is worth taking.
The target is part of the trade thesis.
It is not an afterthought.
ATR Targets and Stop Placement Must Work Together
Suppose:
ATR = 20 pips.
You choose a 1.5 ATR target = 30 pips.
But your stop is 35 pips.
Your reward-to-risk is:
30 ÷ 35 = 0.86R.
You are asking the market to travel 1.5 ATR while risking almost 1.75 ATR.
That may be completely inappropriate for the strategy.
This is where the target and stop design must be considered together.
Do Not Shrink the Stop to Manufacture R
There is another trap.
The trader wants a 2R target.
The market gives only 30 pips of realistic upside.
The trader needs a 15-pip stop to achieve 2R.
So they place the stop inside normal market noise.
Now the R multiple looks excellent.
The trade quality is terrible.
Risk should be based on invalidation.
The target should be based on a realistic opportunity.
Do not manipulate either variable to make the arithmetic look attractive.
Position Size Comes After the Stop
This is where many traders miscalculate risk.
The ATR target may help define potential reward, but position size should be determined from the initial stop and your predetermined account risk.
The DayTradersDiary Position Size Calculator can remove much of the guesswork here.
Suppose your account risk is $100.
Your structural stop is 20 pips.
The position size should be calculated from that 20-pip risk.
If a different arrangement demands a 35 pip stop, the position size should decrease.
Do not add to the position just because your ATR target seems good.
Opportunity in the target forecasts.
The halt specifies the risk.
ATR Multiples and Execution
Your theoretical target can be excellent and still produce a poor real-world result.
Why?
Execution.
If you are trading a fast market, the price can approach your target quickly and then reverse.
A limit order could be executed.
An exit at discretion may be reluctant.
Market departure may involve slippage.
This is especially true around the time of economic releases.
If the strategy depends on capturing exactly 1.5 ATR, then slight changes in execution are important.
That is another reason to evaluate the strategy using realistic historical and live data rather than idealized chart measurements.
When ATR Targets Work Best
ATR multiples are particularly useful when the strategy has a clear relationship with volatility.
Breakout strategies can benefit from expansion, as expansion is directly related to the changing range.
Momentum strategies can use ATR to avoid setting overly small targets during strong price moves.
Trend continuation strategies can use ATR as an objective framework for capturing normal expansion while leaving room for larger moves.
But ATR targets are less useful when the price is heavily constrained by nearby structure, and the market is repeatedly rotating within a narrow range.
When ATR Targets Can Fail
When an ATR target becomes unreliable:
Volatility changes dramatically on a big news occurrence.
Range to pattern market moves.
The market goes from trend to range.
ATR is calculated from a period that no longer resembles current conditions.
The target lies directly behind major support or resistance.
The setup itself has weak directional expectancy.
The trader treats ATR as a price prediction rather than a volatility measure.
The last point is the biggest.
ATR cannot rescue a bad setup.
The News Spike Problem
Imagine ATR(14) is normally 12 pips.
A major CPI release produces several 30-pip candles.
ATR jumps to 18 pips.
Your 2 ATR target is now 36 pips.
But the market has become highly unstable.
You may have a larger target without a proportionally stronger directional edge.
This is why news conditions should be tagged separately in your journal.
Do not combine normal-session and news-session trades, and assume the same ATR multiple means the same thing.
Build a Target Matrix
One practical way to organize your research is to create a target matrix.
Test:
0.5 ATR
0.75 ATR
1 ATR
1.25 ATR
1.5 ATR
2 ATR
Then break results down by:
Setup type.
Trading session.
Market regime.
Long versus short.
ATR percentile.
News versus normal conditions.
You may find something surprising.
Your breakout strategy may perform best at 1.5 ATR during London but only at 1 ATR during New York.
Your mean-reversion strategy performs best at 0.75 ATR.
Now you are building a real trading edge.
Do Not Optimize Everything at Once
This is where traders get themselves into trouble.
They optimize:
ATR period.
ATR multiplier.
Stop distance.
Entry condition.
Session.
Take-profit method.
Position size.
News filter.
All simultaneously.
Eventually, the backtest looks incredible.
But you have no idea which variable actually created the result.
Change one variable at a time.
Start with the target multiple.
Then evaluate the ATR period.
Then evaluate session filters.
Then evaluate partial exits.
This gives you a much cleaner research process.
The Robustness Test
Suppose your results look like this:
1 ATR: +0.21R expectancy
1.25 ATR: +0.29R
1.5 ATR: +0.31R
1.75 ATR: +0.30R
2 ATR: +0.19R
That is encouraging.
There is a profitable region around 1.25 to 1.75 ATR.
You do not need to believe 1.5 ATR is the magical answer.
You need to know that your strategy appears robust across a reasonable range.
That is much harder to break in live trading.
ATR Targets and Partial Profit Taking
Suppose your data is:
1 ATR is reached frequently
2 ATR is less common, but it is far more profitable.
One approach is to take half profit at 1 ATR and let the balance aim for 2 ATR.
For example:
50% closed at 1 ATR.
Remaining 50% managed toward 2 ATR.
The exact percentage should be tested.
The purpose is to combine high-frequency realization with exposure to larger moves.
But Partial Profit Is Not Free
If you take half off at 1 ATR, your average winning trade may decrease if the remaining position rarely reaches 2 ATR.
So compare:
Full position at 1 ATR.
Full position at 1.5 ATR.
Full position at 2 ATR.
50% at 1 ATR plus 50% at 2 ATR.
You may discover that the simplest approach is best.
Or you may find that the hybrid produces a better equity curve.
Let the data decide.
The Psychology of ATR Profit Targets
There is a psychological advantage to ATR targets that is often overlooked.
They move your decision away from dollar amounts.
If your target is $300, you may become emotionally attached to that number.
If your target is 1.5 ATR, the decision depends on market behavior.
That does not eliminate emotion.
But it gives the emotion less authority.
You are essentially saying:
“I will accept a profit when price completes the movement defined by my tested strategy.”
That is much healthier than:
“I need this trade to make $300.”
Avoid Changing the Target Because of Open Profit
This is one of the most expensive habits in day trading.
Trade reaches +1 ATR.
You move the target farther because the trade looks strong.
Trade reaches +1.4 ATR.
You move it again.
Trade pulls back.
Eventually, you exit at +0.3 ATR.
The trader believes they made a good discretionary decision because the market initially looked strong.
But the actual process was inconsistent.
If you want dynamic profit-taking, create a dynamic rule before entering.
Do not invent the rule while watching the P&L.
Journal the Target in ATR Units
Your Trade Journal Template should include more than entry and exit.
Add:
ATR at entry.
ATR period.
ATR timeframe.
ATR multiple target.
Structural target.
Initial stop.
Target in R.
MFE in ATR.
MAE in ATR.
Whether the target was reached.
Whether the structure caused an earlier exit.
Whether volatility expanded or contracted after entry.
This turns your journal into a research database.
MFE in ATR Can Expose a Hidden Edge
Let’s say you notice that your trades typically approach 1.2 ATR, but seldom 2 ATR.
You might be wasting time waiting for oversized targets.
Alternatively, you might discover that trades that reach 1 ATR within the first 10 minutes have a much higher probability of reaching 2 ATR.
That is valuable.
Now you can build conditional logic:
If the price hits 1 ATR quickly and the structure holds, ride a runner to 2 ATR.
That’s a much more complicated than saying:
“My target is 1.5 ATR.”
Time Can Be Another Filter
Price targets should not be considered independently of time.
Suppose your setup normally reaches 1 ATR within 20 minutes.
This trade has been open for 60 minutes and has barely moved.
That may be information.
The lack of movement may indicate that the expected expansion in volatility is not occurring.
A time-based exit can therefore complement an ATR target.
For example:
“If price has not reached 0.5 ATR within 30 minutes, reassess.”
Again, test this.
Do not add it simply because it sounds logical.
The Best ATR Target Is Strategy-Specific
There is no universally superior ATR multiple.
A trend-following system may need 2 ATR or more.
A mean-reversion system may work better around 0.5-1 ATR.
A breakout system might use 1.5 ATR as an initial objective and then trail.
A scalp may use a fraction of ATR.
The number is secondary.
The relationship between the number and the strategy is what matters.
A Practical ATR Profit Target Framework
If you want a simple starting framework, use this process.
First, identify the trade’s structural invalidation.
Second, calculate your initial risk.
Third, calculate ATR on the execution timeframe.
Fourth, choose a candidate target such as 1 ATR, 1.5 ATR, or 2 ATR.
Fifth, compare that target with the nearby structure.
Sixth, calculate the realistic R multiple.
Seventh, reject the trade if the realistic target does not meet your minimum R requirement.
eighth, Record the trade’s MFE in ATR units.
Ninth, after a reasonable sample, check the distribution.
Tenth, Change your aim only when the facts suggests that your existing rule is leaving expectancy on the table.
That is a complete framework.
A Full Example
Think back to a long EUR/USD set up.
Entry: 1.0850
Structural stop: 1.0830
Initial 20 pips risk.
5-min ATR: 16 pips
Selected target multiple: 1.5 ATR
ATR target:
16 x 1.5 = 24 pips
Raw target:
1.0874
Now examine the structure.
Resistance stands at 1.0870.
So the realistic aim is somewhere around 20 pips.
R multiple:
20 / 20 = 1 R.
Suppose that your lowest acceptable reward is 1.5R.
You skip the trade.
An inexperienced trader might enter because the setup “looks bullish.”
A disciplined trader recognizes that the market does not provide enough room relative to the risk.
That is an edge.
Another Example With Better Conditions
Entry: 1.0850
Stop: 1.0830
Risk: 20 pips
ATR: 18 pips
Target: 1.5 ATR
Target distance: 27 pips
Raw target: 1.0877
Nearest meaningful resistance: 1.0885.
The structure provides enough room.
27 ÷ 20 = 1.35R.
Still below a 1.5R minimum.
You could either reject the trade or test whether the strategy justifies a 2 ATR target.
2 ATR = 36 pips.
Target = 1.0886.
Resistance is around that area.
Now the trade offers approximately 1.8R.
But you need historical evidence that your setup can reasonably reach 2 ATR.
This is where your research comes in.
ATR and the Position Size Calculator
The ATR target should never tempt you into increasing risk.
If volatility rises, your target may become larger.
Your stop may also need to become larger.
As the stop gets wider, your position size decreases if your dollar risk remains constant.
This is where using the Position Size Calculator becomes useful.
The calculator helps translate the structural stop into an appropriate position size, rather than forcing the stop to fit an arbitrary lot size.
That distinction is critical.
The market determines the stop.
Your risk budget determines the size.
The ATR target helps determine whether the potential reward justifies taking the trade.
Scaling With Professional Capital
Once you have a tested target framework, consistent execution becomes more important than finding another indicator.
At some point, traders with a genuine edge may face a different constraint: their strategy works, but the amount of personal capital available limits the dollar value of that edge.
That is where evaluation programs can become relevant.
The professional technique to deal with them is not to do:
“I need to have a funded account so I can make money rapidly.
It’s:
I have a procedure documented. “Can I then use it within another firm’s risk framework?”
That is a far more healthy question.
Programs such as The5ers, FTMO, and other proprietary trading firms use different combinations of drawdown limits, profit objectives, trading restrictions, and account structures. Those rules can materially affect whether an ATR-based strategy is suitable.
For example, The5ers’ current High Stakes program specifies defined daily and maximum loss limits, a minimum number of profitable days, and restrictions around high-impact news execution.
Because those rules can change, traders should review the current terms directly before choosing an evaluation.
If your strategy has already demonstrated positive expectancy and controlled drawdown, consider The5ers’ evaluation program as one possible route to accessing larger nominal trading capital.
The evaluation should come after the process.
Not before it.
Why ATR Targets Can Fit Evaluation Accounts
Having a clear ATR target makes risk more quantifiable.
Say your system always starts with a structural halt and you are targeting a tested 1.5 ATR.
Your expected trade geometry becomes more consistent.
That can help you control daily exposure and avoid random expansion of targets.
But there is an important warning.
A strategy that relies on very large ATR multiples may have a low target-hit rate and potentially long periods of unrealized drawdown.
That can be uncomfortable under strict evaluation rules.
So evaluate your strategy using the firm’s actual drawdown model, not just your personal account rules.
The Professional Test
Before taking an evaluation, you should know:
Your average R per trade.
Your worst historical drawdown.
Your largest losing streak.
Your average MFE.
Your average MAE.
Your target-hit distribution.
Your performance by session.
Your performance around news.
Your average number of trades per day.
If you do not know these numbers, you are not ready to scale the capital.
You are still researching the strategy.
Frequently Asked Questions
What is an ATR multiple profit target?
An ATR multiple profit target sets the target distance as a multiple of the Average True Range. For example, if ATR is 20 pips, a 1.5 ATR target is 30 pips from entry.
What is the best ATR multiple for profit targets?
There is no universal best multiple. Many traders test values such as 1 ATR, 1.5 ATR, and 2 ATR, but the appropriate value depends on the strategy, timeframe, volatility regime, and market structure.
Is 2 ATR a good profit target?
It might be especially for breakout or trend following techniques, but a 2 ATR aim should be supported by historical evidence. High ATR multiple usually means accepting a lower target-hit frequency.
Should I use ATR for both the stop-loss and the profit target?
You can, but you don’t have to. A structural stop can help identify when the trade thesis is no longer viable and ATR can help estimate a reasonable profit aim. ATR can place stops and/or targets badly for both if market structure is not taken into consideration.
Should ATR be calculated on the same timeframe as the entry?
Usually, that is a sensible starting point because it measures volatility around the timeframe being traded. However, comparing the execution-timeframe ATR with a higher-timeframe volatility measure can provide useful context.
Does a higher ATR mean I should use a bigger profit target?
Not automatically. Price movement increases with ATR, but not direction. News can boost volatility and weaken directional trading.
Should I move my ATR target when ATR increases after entry?
General rule, do not change the initial target just because ATR is providing extension. Set rules before entry to manage profit dynamically . Partial profit at original target , trailing stop for rest .
How is 1 ATR or 2 ATR better?
Same entries and initial stop for backtesting. Expectation, avg R, drawdown, target-hit rate, MFE, equity-curve stability. Consider more than win rate while setting goals.
Can ATR targets be used for Forex day trading?
Yes. ATR can be calculated on intraday charts and used as a volatility reference for target planning. Fidelity notes that ATR can be applied to intraday periods and that shorter periods can be useful for measuring recent volatility.
Can I combine an ATR target with support and resistance?
Yes, and this is often more useful than using ATR alone. ATR can estimate the distance, while support and resistance identify areas where the move may stall. The final target should account for both.
Final Takeaway
ATR should not become another indicator that traders unthinkingly follow.
Its real value is that it forces you to quantify something traders often estimate emotionally: how much movement the market is actually producing.
A profit target of 30 pips means very little by itself.
Thirty pips with a 10-pip ATR is a very different proposition from thirty pips with a 30-pip ATR.
That is why the strongest ATR target framework is not simply:
Entry + 1.5 ATR = Take Profit.
It is:
Measure volatility → identify structure → calculate realistic reward → check R multiple → execute the tested target → record the outcome.
The next step is to stop asking which ATR multiple is “best.”
Take your next 50 trades and record the MFE in ATR units.
Find out how often your setups reach 0.5 ATR, 1 ATR, 1.5 ATR, 2 ATR, and beyond.
Then compare those distances with your actual expectancy.
You may discover that your strategy has been taking profits too early.
You may discover that your targets are too ambitious.
Or you may discover something more valuable: your best target changes with the setup and market regime.
That is the kind of information that turns an indicator into a trading process.
For the next stage of your research, read your existing DayTradersDiary.com material on backtesting a day trading strategy and apply the same discipline to your exit rules. The biggest improvement may not come from finding.