
If you’ve traded long enough, you’ve probably had this experience.
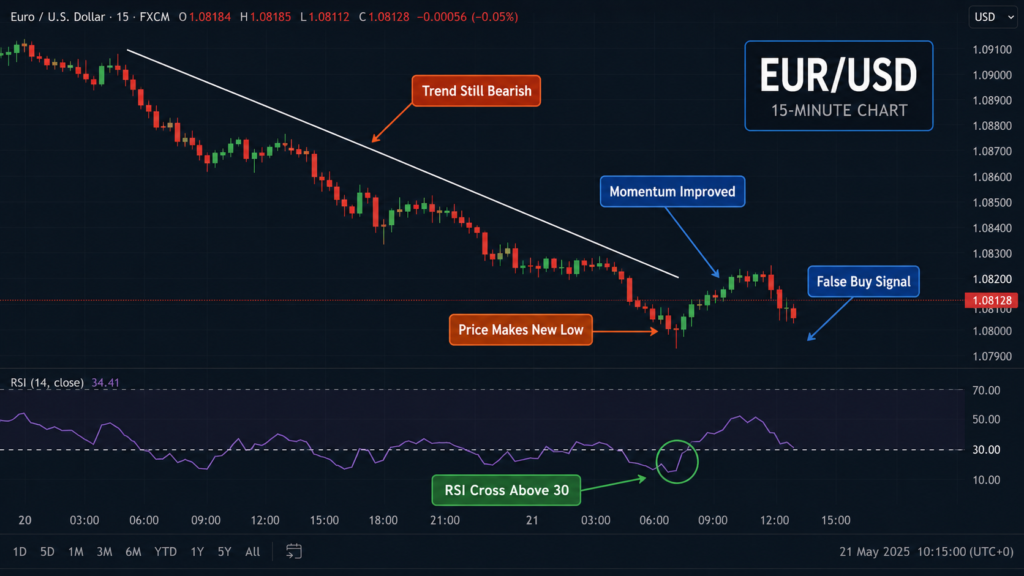
The RSI crosses above 30, signaling that selling pressure is fading. You buy with confidence because the indicator finally agrees with your plan.
Within minutes, the price falls even further.
A day later, RSI crossed below 70. This time, you short the market, convinced the rally has ended.
Instead, buyers step back in and push prices to fresh highs.
After repeating this cycle enough times, traders often conclude that RSI is unreliable.
It isn’t.
The problem is that most traders expect RSI to tell them what the market will do next when it was designed to show what momentum is doing right now.
That difference is subtle, but it completely changes how the indicator should be used.
Over the years, one pattern has become obvious while reviewing trading journals from both profitable and struggling traders. Consistent traders rarely use RSI as an entry signal by itself. They use it as one piece of evidence within a broader decision-making process that includes market structure, liquidity, volatility, and risk management.
This article explains why false RSI cross signals happen, how to filter them before they become losing trades, and how experienced day traders turn RSI from a source of frustration into a valuable confirmation tool.
Why False RSI Cross Signals Happen
The Relative Strength Index, developed by J. Welles Wilder Jr., measures the speed and magnitude of recent price changes. It is one of the best tools available for identifying shifts in momentum.
What RSI does not measure is market intent.
Momentum can change briefly without changing the overall trend.
Imagine a strong bullish market.
Price pulls back sharply for several candles.
RSI drops below 30 before crossing back above it.
Many traders immediately buy.
Sometimes that works because the pullback has ended.
Other times, the price pauses before continuing lower, creating another oversold reading.
The indicator behaved exactly as designed.
The market was in no shape to turn around.
RSI false signals happen when traders take a short-term momentum shift as a full-blown trend reversal.
Research Confirms RSI Works Best With Context
The effectiveness of RSI has been studied extensively for decades, and one conclusion appears consistently across educational and research sources.
RSI should not be used in isolation.
The Corporate Finance Institute (CFI) explains that RSI is most effective when combined with trend analysis, support and resistance, and other technical tools rather than treated as an independent buy or sell system.
The CME Group emphasizes that successful market analysis comes from combining momentum, volatility, and price action instead of relying on a single technical indicator.
The Chartered Market Technician (CMT) Association also promotes a weight-of-the-evidence approach, where multiple independent factors increase confidence in a trading decision instead of depending on one indicator.
For active day traders, the message is straightforward.
RSI becomes more reliable when it confirms your analysis, not when it replaces it.
Stop Treating RSI Crosses as Automatic Entries
One of the biggest mindset shifts a trader can make is changing the role RSI plays.
Not asking, ” Should I buy because RSI crossed above 30? “
Ask “What is this crossover saying about momentum and does the chart agree?”
Those are other questions altogether.
RSI is used by professional traders as a filter.
Many novices use this as a trigger.
That difference alone removes a lot of wasteful trading.
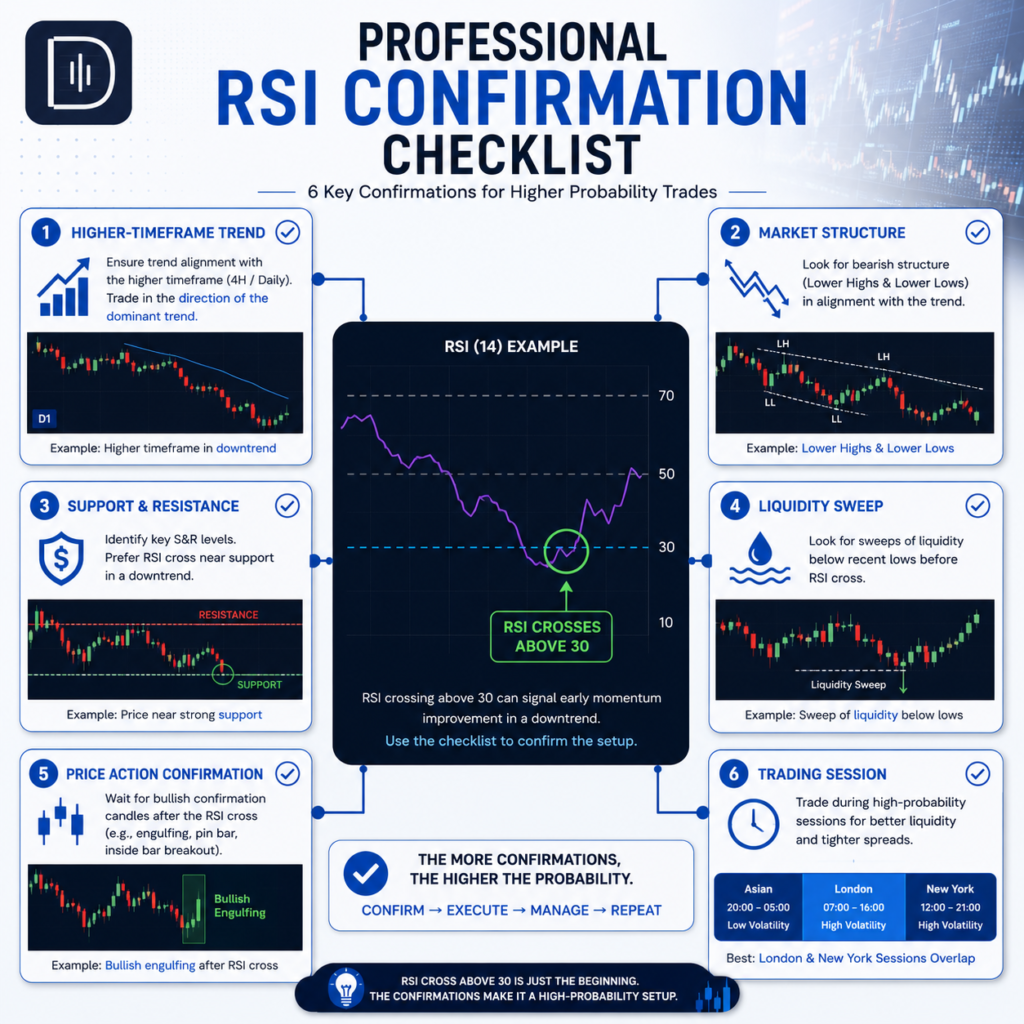
Rule One: Trade in the Direction of the Higher-Timeframe Trend
The fastest way to eliminate false RSI signals is to stop fighting higher-timeframe momentum.
Suppose the daily chart continues making higher highs and higher lows.
The four-hour chart remains above its key support.
A short-term pullback pushes RSI below 30 on the fifteen-minute chart.
That bullish crossover now aligns with the larger trend.
Compare that with buying the same RSI crossover while the daily chart is making lower lows.
The indicator is identical.
The probabilities are not.
The market rewards traders who trade with momentum far more often than those attempting to predict every reversal.
This principle is discussed in greater detail in our article Using Pivot Confluence Only With Three Conditions, where a higher-timeframe structure becomes the foundation for every trade.
Rule Two: Wait for Price Action to Confirm RSI
Indicators interpret price.
Price does not interpret indicators.
That means price should always have the final vote.
Suppose RSI crosses above 30.
Before entering, ask several questions.
Has the price broken a lower high?
Has a bullish rejection candle formed?
Has support actually held?
Has momentum shifted on the chart itself?
Waiting for confirmation usually means sacrificing a few points or pips.
In return, you avoid many false entries that reverse immediately after the crossover.
Traders know that confirmation adds more quality than early entry add earnings.
Rule Three: Understand That RSI Behaves Differently in Trends
Many traders learn one simple rule.
Above 70 equals overbought.
Below 30 equals oversold.
The problem is that strong trends ignore simple rules.
In healthy bull markets, RSI often spends long periods above 60 and repeatedly reaches overbought territory without producing meaningful reversals.
Likewise, powerful downtrends frequently keep RSI below 40 for extended periods.
Selling every overbought reading during an uptrend is one of the quickest ways to fight institutional momentum.
Instead of asking whether RSI is overbought, ask whether the market is trending.
The answer often matters far more.
Rule Four: Use Liquidity as a Confirmation Filter
One of the highest-quality RSI signals often appears after liquidity has already been collected.
Imagine price breaks below yesterday’s low, triggering stop losses before immediately recovering.
At the same moment, RSI crosses back above 30.
Now the indicator confirms something meaningful.
Price has swept liquidity.
Selling pressure has weakened.
Momentum is improving.
Compare that with an identical RSI crossover in the middle of an empty trading range.
The indicator is the same.
The surrounding evidence is not.
This concept connects naturally with our guide What Does Liquidity Sweep Look Like on a Chart, where liquidity explains why some reversals become trends while others disappear.
Rule Five: Respect Market Sessions
The effectiveness of RSI indicators is not uniform throughout the trading day.
Often a crossover in the quiet overnight session does not have the involvement necessary to keep momentum.
The same signal during the London open or the London and New York overlap may carry much more significance because institutional activity increases dramatically.
Always ask yourself whether enough market participation exists to support the move you expect.
Our article How Many Pips Do London Session Breakouts Average explains why session timing plays such an important role in trade quality.
Build a Decision Framework Instead of Chasing Signals
Rather than reacting every time RSI crosses a level, create a structured routine.
First determine the trend of the higher time range.
Identify key support, resistance and liquidity areas.
Check out upcoming economic events.
Assess present volatility.
RSI must be in sync with your market bias.
Check pricing action for confirmation.
Then decide if the trade is worth the risk.
Note that RSI is just one checkpoint and not the whole strategy.
One alteration can often make a difference in trading results.
There Is No Perfect RSI Setting
Every few months, traders begin searching for a better RSI period.
Some switch from 14 to 9.
Others experiment with 21 or 5.
The assumption is that a different setting will eliminate false signals.
It rarely does.
A shorter RSI reacts faster but generates more noise.
A longer RSI filter has more noise but responds later.
Neither is objectively superior.
The better approach is choosing a setting that complements your strategy and then testing it over hundreds of trades before making changes.
Consistency creates better data than constant optimization.
Risk Management Is More Important Than Signal Quality
Even the greatest RSI filters cannot remove losses.
Markets are still uncertain.
We are not looking for 100 percent accuracy.
It is maintaining positive expectancy over time.
One common mistake occurs when traders increase position size simply because multiple confirmations exist.
Confidence should never determine risk.
This is where most traders miscalculate risk. Using the Position Size Calculator removes guesswork by calculating the correct position size based on your account risk and stop-loss distance instead of emotion.
Consistent position sizing allows even excellent strategies to survive inevitable losing streaks.
Turn Every RSI Trade Into Research
Most traders remember the dramatic wins and frustrating losses.
Very few remember the average trades.
That selective memory breeds a false confidence.
Begin tracking each trade via RSI.
Keep track of time frame.
Mark if trend on higher time frame was aligned.
Check Liquidity was available.
Market Session, Volatility & Confirmation Pattern. Document.
After one hundred trades, you’ll begin noticing patterns you would never have discovered by memory alone.
Your best RSI trades occur only during the London session.
Every losing trade ignored the higher-timeframe structure.
Those observations become your personal edge.
Our downloadable Trade Journal Template makes this process easier by helping you evaluate execution quality instead of focusing only on profits.
Scaling a Repeatable Trading Process
Professional capital is rarely earned through finding a magical indicator.
It is earned through consistent execution.
Evaluation firms such as The5ers, FTMO, and FundedNext look for traders who can follow a repeatable process while managing risk responsibly.
An RSI strategy supported by structure, liquidity, disciplined execution, and careful journaling is far more likely to remain consistent than one based solely on indicator crossovers.
If your trading journal demonstrates positive expectancy across a meaningful sample of trades, a The5ers evaluation account can become a logical step toward managing larger capital without continually increasing your personal investment.
Final Thoughts
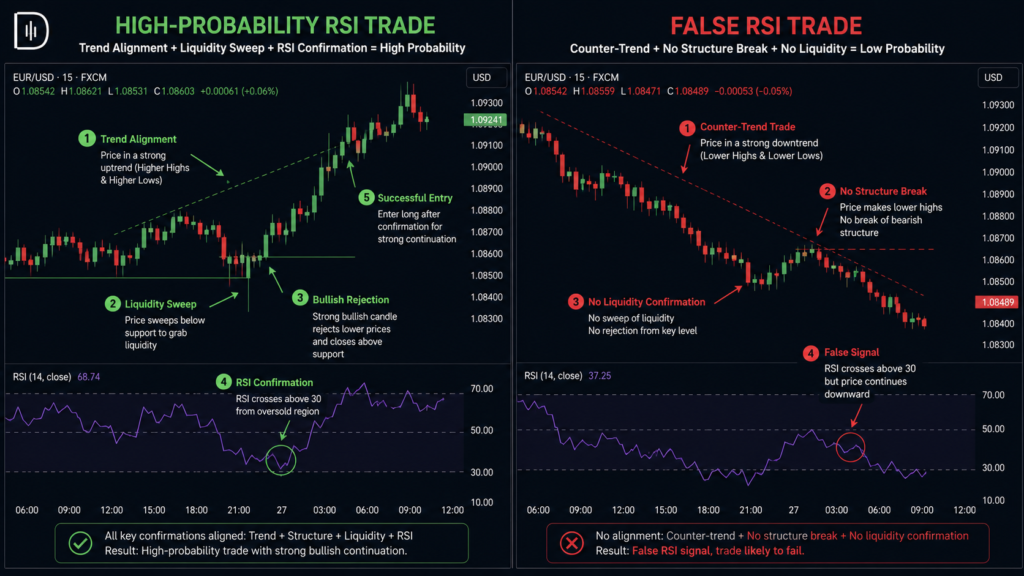
False RSI cross signals are not proof that RSI has stopped working.
More often, they reveal that the indicator was asked to perform a job it was never designed to do.
RSI measures momentum.
It is not a substitute for market structure.
It’s not a substitute for liquidity.
It is not a substitute for rigorous execution.
The best traders use RSI as a confirmation, not a prediction.
For the next twenty trading sessions, challenge yourself to ignore every RSI crossover until price confirms your idea.
You will probably take fewer trades.
You will almost certainly improve their quality.
For your next read, continue with How To Build A Tick-Based Day Trading Checklist and make RSI confirmation one of the required checkpoints before every trade.
Frequently Asked Questions
Why do RSI cross signals fail?
The reason RSI crossover signals fail so often is that momentum can change before the overall trend changes. If you do not consider market structure, liquidity and price action then many crosses are false entry.
How can I avoid false RSI cross signals?
Trade the higher time frame trend. Wait for price confirmation. Watch for liquidity zones. Stay out of low volatility sessions. Use RSI for confirmation but not for entries.
Is RSI better for trending or ranging markets?
RSI works in both conditions, but it should be interpreted differently. In trending markets, overbought and oversold readings can persist, while in ranging markets, they are more likely to identify potential reversals.
Should I buy every RSI crossover above 30?
No, not at all. A crossover above 30 is not an automatic trade and requires further investigation. Confirm the indication with price action, market structure and trend direction.
What is the best RSI period for day trading?
The traditional 14-period RSI is still the one most commonly used; however, the best setting depends on your trading strategy, timeframe, and market. More important than changing settings all the time is consistency and testing.
Can RSI be combined with other trading tools?
Yes. RSI becomes significantly more reliable when combined with support and resistance, liquidity sweeps, pivot confluence, market structure, and disciplined risk management rather than being used on its own.