
You see a trading opportunity on the chart. Price is increasing, momentum seems good, and your moving average has finally gone up. You jump into a trade, confident it’s going to continue. Then price retraces, your indicator flips, and that opportunity you thought you had… starts to look like a bad decision.
This is one of the frustrations traders face with traditional indicators. Many are built to smooth out price movements, which makes them easier to read but can also make their signals arrive late.
Zero-lag indicators aim to reduce that delay. They can help you recognize changes in momentum sooner, but they are not a shortcut to better trades. A faster signal can still be wrong, especially when the market is moving sideways.
The real skill is knowing when a zero-lag signal deserves your attention and when it is better to leave it alone.
What Are Zero-Lag Indicators?
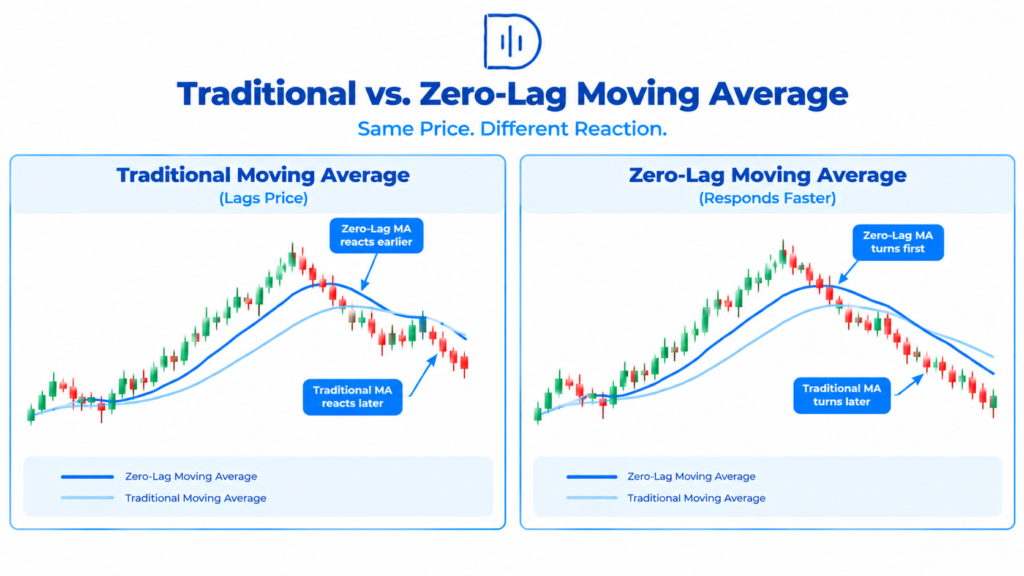
Most technical indicators use historical prices to calculate their readings—moving averages, for example, smooth price data to make the general direction easier to see. The trade-off is that they react after Price has already moved.
Zero-lag indicators try to reduce this delay. They use different calculation methods to make their readings respond more quickly to changes in Price.
That sounds like an obvious improvement, but there is a catch. Reducing lag can also make an indicator more sensitive to short-term price fluctuations. A quicker response does not automatically mean a more reliable signal.
Think of it this way: a traditional moving average may help you see the bigger picture, while a zero-lag version may help you notice a possible change earlier. Both can be useful, but neither should make the trading decision on its own.
Traders interested in the mathematics behind these tools can explore John Ehlers and Ric Way’s work on Zero Lag (Well, Almost). It offers a useful look at the challenges involved in reducing indicator delay.
Why Traders Use Zero-Lag Indicators
The main attraction is timing. In day trading, a delayed signal can leave you entering after much of the move has already happened.
A zero-lag indicator may help you notice a momentum shift earlier, identify a developing trend, or avoid waiting too long for a traditional moving average to turn.
For example, imagine a stock has been moving higher throughout the morning. It pulls back toward a support area, and selling pressure begins to weaken. A zero-lag moving average turns upward as Price starts recovering.
That change may be worth investigating. But buying immediately just because the line has turned upward is not a complete trading plan. You still need to check whether buyers are actually stepping in and whether there is enough room for Price to move.
The indicator gives you a reason to pay attention. The chart provides the rest of the evidence.
How To Read Zero-Lag Signals Without Rushing Into Trades
A common mistake is treating every crossover as a buy or sell instruction. This is where traders often get caught during choppy sessions.
Instead of reacting to the first change in the indicator, look at what Price is doing around it.
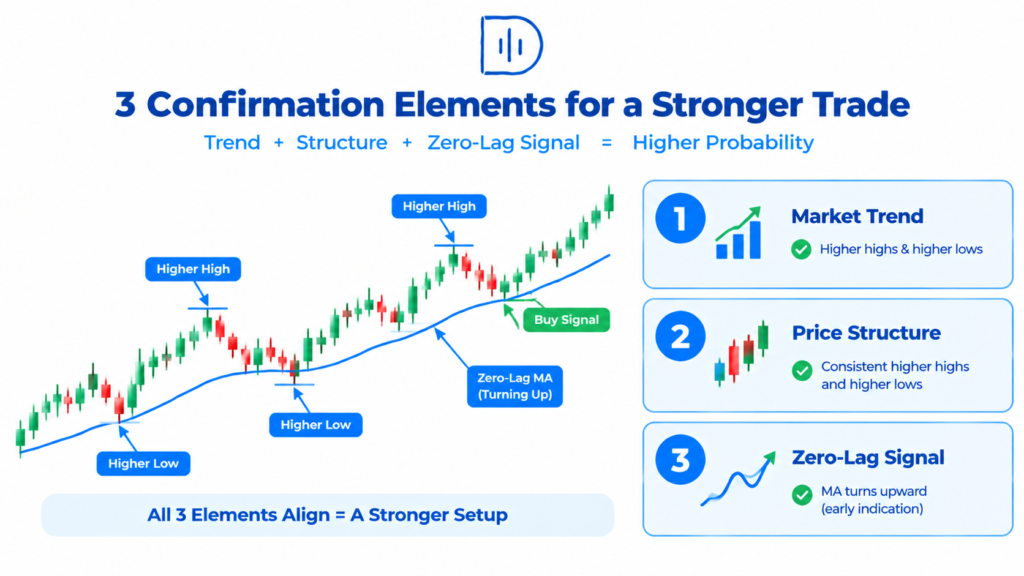
Suppose a zero-lag moving average crosses above a slower moving average. That may suggest improving bullish momentum. Before entering, check whether Price has broken a meaningful resistance level or formed a higher low after a pullback.
If the crossover happens directly under resistance, the trade may have limited room to develop. If it happens after a clean pullback in an established uptrend, the setup may deserve closer attention.
The same idea applies to bearish signals. A downward crossover is more interesting when Price is also making lower highs, breaking support, or struggling to recover after a failed rally.
You are not trying to collect as many signals as possible. You are trying to find situations where the indicator and price action are telling a similar story.
Combine Zero-Lag Indicators With Market Structure
Market structure should come before the indicator.
If a market is making higher highs and higher lows, buyers are generally in control. In that environment, bullish zero-lag signals may be more useful than bearish ones. You can focus on pullbacks and look for signs that the upward move is ready to continue.
In a downtrend, the opposite approach makes more sense. Pay attention to lower highs, lower lows, and failed attempts to reclaim resistance. A bearish zero-lag signal that appears during a weak recovery may offer a better opportunity than one that appears after an extended decline.
Also, be cautious in sideways markets. Price may bounce back and forth above and below an indication several times without ever putting into place a good trend. Be careful with each crossover, since you will be paying fees and spreads, and if you have losses, they will be repeated every time you trade.
This is why it helps to identify the market environment before deciding whether a signal is worth trading.
You can build on this approach with our guide to finding high-probability trading setups.
Choose a Suitable Timeframe
A zero-lag indicator can behave differently depending on the timeframe.
On a one-minute or five-minute chart, it may react quickly, but you will also see more noise. A small price movement can change the indicator’s direction, even when the broader trend remains unchanged.
On a 15-minute or one-hour chart, some of that noise may disappear. However, the signal will usually arrive later, which may not suit every day-trading strategy.
There is no perfect timeframe for everyone. Your choice should match your holding period, trading style, and ability to manage risk.
A common method is to utilize a higher timeframe for the overall direction and a lower timeframe for an entry. The one-hour might be your bullish trend, and the five-minute might be your retracement and further buying pressure.
Avoid adding more timeframes simply because you want extra confirmation. Too many charts can create conflicting opinions and make it harder to act when a genuine opportunity appears.
Watch Out for False Signals
Zero-lag indicators are not immune to false signals. In fact, their faster response can sometimes make them more vulnerable to short-term market noise.
A crossover during a quiet session may look convincing but fail as soon as trading activity increases. A signal near a major news release can also become irrelevant within seconds if the Price moves sharply in the opposite direction.
Pay attention to where the signal appears. A bullish crossover near a well-tested support zone may have a different meaning from one that appears after Price has already rallied several candles.
Also consider how far Price has moved before you enter. If the market has already traveled a large distance, chasing the signal may leave you with poor risk-to-reward potential.
Sometimes the best decision is to skip the trade. Missing an opportunity is frustrating, but entering a weak setup to avoid feeling left behind is usually more expensive.
Backtest Before Using Real Money
An indicator that looks impressive on a chart may behave very differently when you trade it consistently.
Before using a zero-lag indicator with real money, test it against historical market data. Choose a market, timeframe, and set of entry conditions. Then review enough trades to understand how the method performs in trending, ranging, and volatile conditions.
Do not change your rules every time you see a losing trade. A strategy needs a consistent set of conditions before you can judge whether it has an edge.
Pay attention to more than the win rate. Average profit, average loss, drawdown, losing streaks, and trading costs all matter. A strategy that wins frequently can still lose money if its losing trades are much larger than its winners.
Our guide on how to backtest a day-trading strategy can help you build a more structured testing process.
Manage Risk Before You Enter
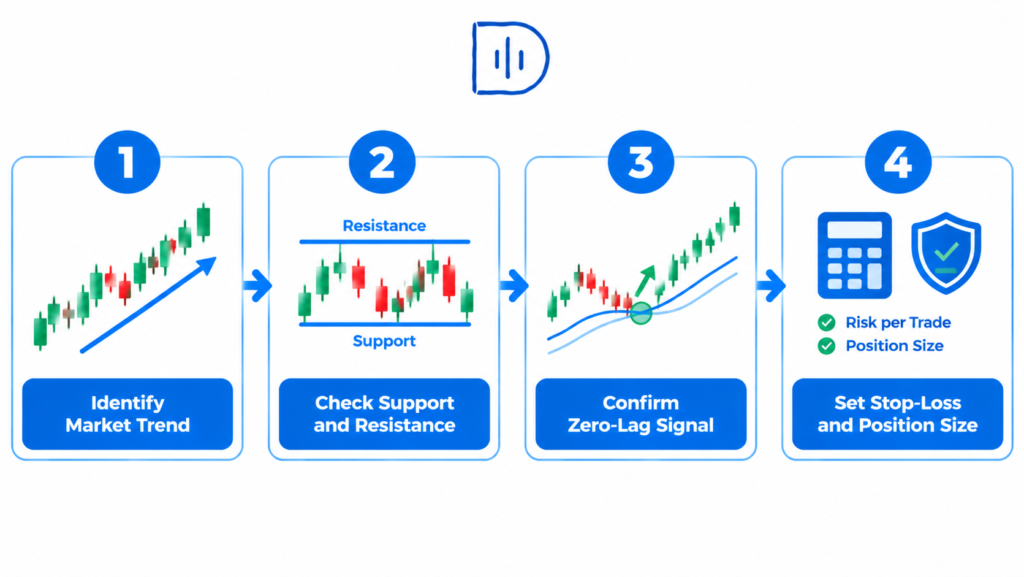
Even a strong-looking zero-lag signal can fail. That is why your stop-loss and position size should be decided before you open the trade.
Start by identifying the price level that would prove your trade idea wrong. This might be below a recent swing low for a bullish setup or above a recent swing high for a bearish one.
Then calculate how much you are willing to lose if the stop is reached. Your position size should fit that amount, rather than being chosen because the signal looks especially convincing.
The Day Traders’ Diary Position Size Calculator can help you work out an appropriate trade size based on your account balance, risk percentage, and stop-loss distance.
A faster indicator should never become an excuse to take larger risks. Your job is to control the loss when the market does not behave as expected.
Keep a Record of Your Signals
Look at the signals you traded after the session.
Was the market ranging or trending? Was the zero-lag signal at support or resistance? Did you wait for confirmation of Price, or did you jump in when the indicator flipped? How was your trade?
These details can reveal patterns that are easy to miss while trading live.
You may discover that your signals work better during the London or New York session, or that they produce too many false entries during low-volume periods. You might also find that waiting for a candle close improves your results, even if it means entering slightly later.
Use the Trade Journal Template to record your setups, decisions, and results. Over time, your journal can help you decide whether the indicator genuinely improves your strategy or makes the chart look more interesting.
Can Zero-Lag Indicators Help With Funded Trading?
They can be part of a funded trading strategy, but the same rules apply. A zero-lag signal does not remove the need for discipline, sensible position sizing, or drawdown control.
If you are trading a funded account, remember to grasp the regulations of the firm evaluation before using the method. If there are daily loss limits, max draws, limitations on trading, or consistency limits, your trade management is impacted.
Traders can explore programs from The5ers and FTMO. Stock traders may also want to look into TradeThePool, which focuses on stock trading.
Do not choose an evaluation simply because you believe a faster indicator will help you pass. Test your complete trading method first, including its losing periods. A strategy that fits the firm’s risk rules is more useful than one that produces occasional impressive wins.
Frequently Asked Questions
Are zero-lag indicators better than normal moving averages?
Not really. They are meant to prevent latency and so can help traders identify changes more quickly. But they’re more sensitive to market noise, too. Which is best depends on your plan and the conditions you are trading in.
Which zero-lag indicator is best for day trading?
There is no single best option. Zero-lag moving averages and other reduced-lag indicators can be tested, but you should choose one that is easy to understand and fits your trading method. Avoid switching indicators every time you experience a losing streak.
Can I use zero-lag indicators for scalping?
Scalping needs attention… but yes. The faster signals are best for short timeframes; however, these signals can be reduced due to slippage, spreads, and brief price movements. Test the indicator with realistic trading costs before believing it.
Do zero-lag indicators repaint?
Depends on the indicator and what you are programming it to do… Some indicators may repaint the current value while the candle is forming. Read the history and confirm the candle closes, and practice with it.
Should I use more than one zero-lag indicator?
Generally, it is best to have just one signal that you really understand. Clusterf*cking several indicators on comparable things tends to clatter without delivering any proof. You still should base your decision-making on price activity, market structure, and risk management.
Can zero-lag indicators predict market reversals?
Not really. But they can’t tell you future answers. They require confirmation on price and market structure.
Final Thoughts
Zero-latency indicators can get you a more responsive chart, but regardless of the speed at which you get information, it is useless unless you have a clue about what to do with it.
Don’t buy every bullish crossover or sell every bearish crossover. Instead, begin with market structure and important price points, and use the indicator to confirm what you already see. If the signal is at a terrible location or does not make sense on the bigger market, ignore it.
Here is a simple exercise for your next trading session: choose one zero-lag indicator and observe its signals without placing trades. Record where each signal appears, what Price does next, and whether the market is trending or ranging. After reviewing enough examples, you will have a much clearer idea of when the indicator deserves a place in your strategy.
The goal is not to trade faster. It is to make better decisions with the information available.