
A trader can finish a session profitable and still have taken far more risk than the final result suggests.
Imagine a day where you start with $10,000, fall to $9,760, recover to $9,900, lose another $80, and finally close at $10,080.
The final result is +$80.
Looks good.
But the account experienced a $240 intraday drawdown before recovering.
That $240 tells you something the final P&L does not.
This is why average drawdown per session is such a useful number for active day traders. It shows how much pain your strategy normally experiences before it produces its outcome.
More importantly, it helps answer questions that ordinary win rate and average profit cannot answer:
How deep does a normal trading session go against you?
How often do you approach your daily loss limit?
Does London produce smaller drawdowns than New York?
Are your losing sessions actually caused by poor setups, or by excessive trading after an early loss?
And if you trade a prop firm account, how much of the firm’s permitted drawdown are you actually consuming during an ordinary session?
They are not theoretical questions.
They have a direct impact on position size, session selection, number of trades, psychological burden and your ability to survive long enough for your edge to work.
What Is Drawdown in Day Trading?
Drawdown is the decline in account equity or balance from a previous peak to a subsequent trough.
The important word is peak.
Drawdown is not simply the amount you lost on your last trade.
If your account rises from $10,000 to $10,300 and then falls to $10,100, your drawdown is $200 from the $10,300 peak.
It is not $100 just because you are still $100 above your original starting balance.
For session analysis, this distinction becomes extremely important.
A trader may start the session at $10,000, make $300 during the first few trades, then lose $180.
The final balance may be $10,120.
But the session experienced a $180 drawdown from its intraday equity peak.
That drawdown represents the amount of capital and psychological pressure the strategy had to withstand.
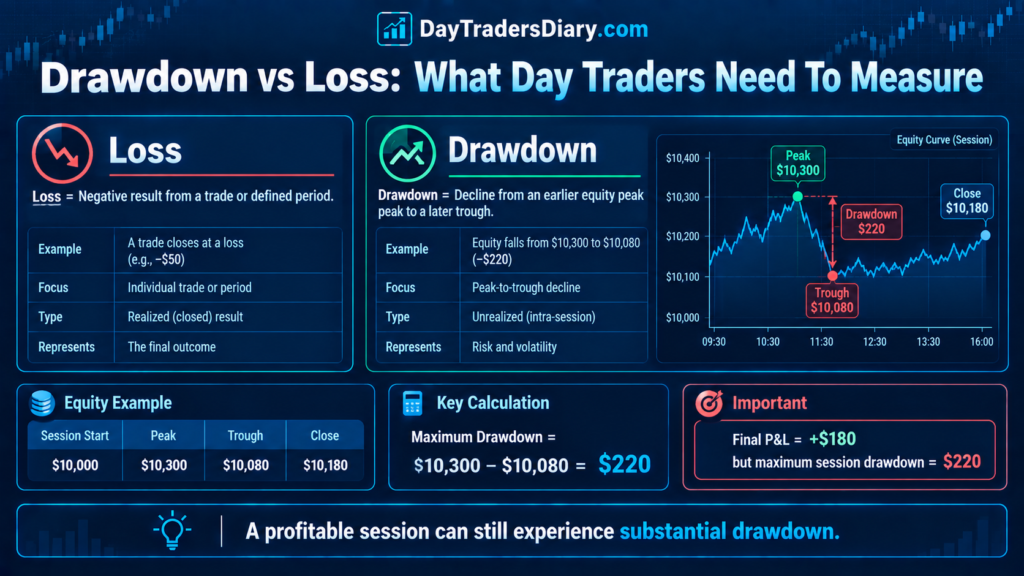
Drawdown vs Loss
These terms are often used interchangeably, but they describe different things.
A loss is normally associated with an individual trade or a defined period’s negative result.
Drawdown measures the decline from a previous equity high.
Consider this sequence:
PointEquity
Session start $10,000
Trade 1 $10,150
Trade 2 $10,300
Trade 3 $10,220
Trade 4 $10,080
Session closed $10,180
The session finishes with a $180 profit.
But the maximum session drawdown was:
$10,300 − $10,080 = $220
That $220 is the number worth studying.
Your strategy made money, but it required you to tolerate a $220 decline from the session’s high-water mark.
The Average Drawdown Per Session Formula
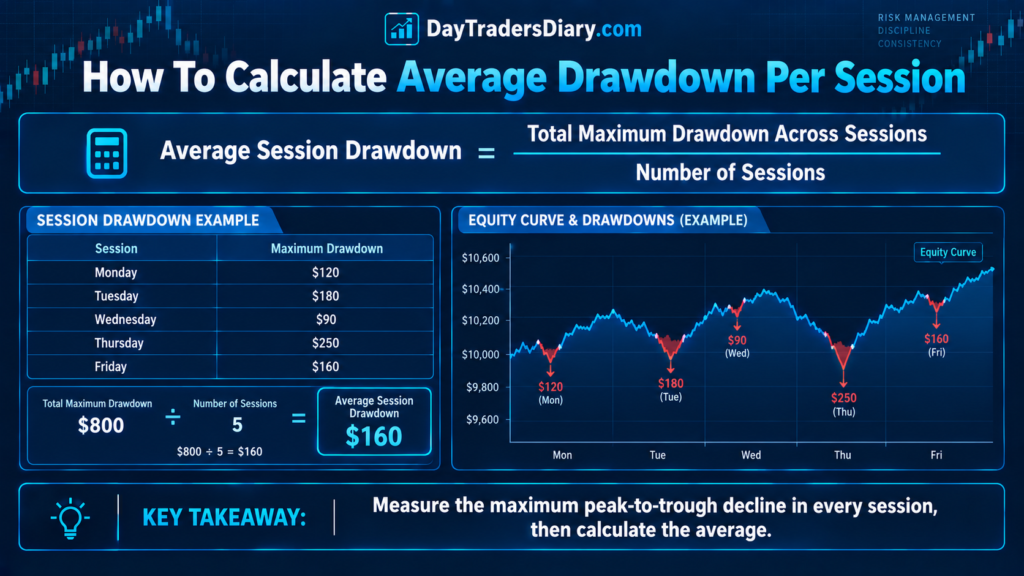
The simplest calculation is:
Average Session Drawdown = Total Maximum Drawdown Across Sessions ÷ Number of Sessions
Suppose you record five sessions:
Session Maximum Drawdown
Monday $120
Tuesday $180
Wednesday $90
Thursday $250
Friday $160
Total drawdown:
$120 + $180 + $90 + $250 + $160 = $800
Number of sessions:
5
Therefore:
Average Session Drawdown = $800 ÷ 5 = $160
Your average maximum drawdown per session is $160.
That is the first useful number.
But it is not the only number you should calculate.
The average can hide the most important information.
A trader with session drawdowns of:
$100, $100, $100, $100, $600
also has a $200 average.
Yet the $600 session tells you something completely different from a strategy that consistently experiences $180 to $220 drawdowns.
This is why professional analysis should never stop at the average.
Calculate Drawdown in Percentage Terms
Dollar drawdown is useful, but percentage drawdown makes different account sizes and trading periods easier to compare.
The basic formula is:
Session Drawdown % = Maximum Session Drawdown ÷ Session Starting Equity × 100
Suppose you start the session with $20,000.
Your maximum intraday drawdown is $300.
Therefore:
$300 ÷ $20,000 × 100 = 1.5%
Your maximum session drawdown was 1.5%.
Now imagine another session starts with $25,000 and experiences a $375 drawdown.
That is also:
$375 ÷ $25,000 × 100 = 1.5%
The dollar values are different, but the risk behavior is identical.
This is why percentage-based session drawdown is usually more useful when comparing performance across different account sizes.
But There Is a Better Measurement: Drawdown From the Session Peak
For active day traders, I recommend tracking at least two versions.
The first is the drawdown relative to the session starting equity.
The second is the drawdown relative to the highest equity reached during that session.
For example:
Starting equity: $10,000
Intraday peak: $10,400
Intraday trough after peak: $10,150
Maximum session drawdown:
$10,400 − $10,150 = $250
Peak-based drawdown:
$250 ÷ $10,400 × 100 = 2.40%
Start-based drawdown:
$250 ÷ $10,000 × 100 = 2.50%
The difference is small here.
But it becomes more meaningful when sessions produce large gains before giving some of them back.
Why Average Drawdown Alone Can Mislead You
Suppose two traders both have an average session drawdown of 1.5%.
Trader A:
1.2%, 1.4%, 1.5%, 1.6%, 1.8%
Trader B:
0.3%, 0.4%, 0.5%, 0.7%, 5.6%
Both averages might appear good.
Clearly their trading behavior is not.
Trader A has a constant distribution of losses.
Trader B has a tail event which is rare yet possibly dangerous.
This is why I prefer tracking four numbers:
Average session drawdown
Median session drawdown
Maximum session drawdown
90th-percentile session drawdown
The median tells you what a typical session looks like.
The average captures the overall burden.
The maximum shows the worst observed experience.
The 90th percentile gives you a practical estimate of what a large but not extreme drawdown looks like.
That is much more useful for setting trading limits.
Average Drawdown Per Session by Trading Session
This is where the analysis becomes much more interesting.
Don’t calculate one drawdown number for your entire trading week and assume it applies equally to every session.
Separate the data.
For example:
| SessionAvg | Drawdown | Median | Max |
| Asian | 0.45% | 0.35% | 1.10% |
| London | 0.92% | 0.80% | 2.10% |
| NewYork | 1.18% | 0.95% | 3.20% |
| London/NYoverlap | 1.35% | 1.10% | 3.80% |
Now you have something actionable.
The New York session may produce more opportunities, but it also creates greater equity fluctuation.
The Asian session may have lower drawdown but fewer suitable setups for your strategy.
The answer is not automatically to trade the session with the smallest drawdown.
The question is:
How much return am I receiving for the drawdown I am accepting?
That is a much better performance question.
The Drawdown-to-Return Ratio
Suppose your London session produces:
Average return: +1.2%
Average maximum drawdown: 0.8%
New York produces:
Average return: +1.6%
Average maximum drawdown: 1.6%
The New York session generates more profit, but it requires twice as much drawdown.
You can calculate a simple session efficiency measure:
Session Drawdown Efficiency = Average Session Return ÷ Average Session Drawdown
London:
1.2 ÷ 0.8 = 1.50
New York:
1.6 ÷ 1.6 = 1.00
This doesn’t give a uniform ranking system, but it does allow you to compare the efficiency of different sessions in converting drawdown into return.
A lower-drawdown session may actually be more attractive even if its headline profit is smaller.
The Most Important Distinction: Closed P&L vs Equity Drawdown
This is where many traders make a serious measurement error.
Suppose your account starts at $10,000.
You make $300 on a morning trade.
Then you enter another position that temporarily shows -$250 floating P&L before recovering and closing at +$50.
Your final balance is $10,350.
If you only record closed trades, you may conclude that the session was smooth.
It wasn’t.
Your equity may have experienced a substantial intraday decline.
For serious drawdown analysis, record equity at regular intervals or, preferably, capture the highest equity and lowest equity after each meaningful trading event.
This is particularly important when you trade instruments capable of rapid intraday movement.
Maximum Adverse Excursion and Session Drawdown Are Different
MAE tells you how far a particular trade moved against you.
Session drawdown tells you how far the trading account moved down from an equity peak during the session.
These measurements answer different questions.
MAE asks:
“How much adverse movement does this setup normally experience?”
Session drawdown asks:
“How much account-level pressure does my trading process create during a session?”
You need both.
A trader can have excellent individual trade MAE statistics but a terrible session drawdown because they take too many trades.
That is a critical insight.
Your strategy may not have a risk problem.
Your trading process may have a risk problem.
Three Trades Can Change Your Entire Session Profile
Consider a trader risking 0.5% per trade.
Three consecutive full losses create:
0.5% × 3 = 1.5%
That doesn’t seem dramatic.
But if the trader then sizes up after the third loss and selects a lower quality setup and takes another 1% the session downside becomes:
1.5% + 1.0% = 2.5%
The strategy did not suddenly become worse.
The trader changed the risk distribution.
This is why session drawdown should be connected to trade count, risk per trade, and loss streaks.
Our guide on total risk over consecutive trades is useful here because session drawdown is often the accumulated result of several individually acceptable decisions.
Calculate the Average Drawdown Per Session in R
Dollar and percentage measurements are useful, but experienced traders should also consider R.
If your planned risk per trade is $100, then:
$100 = 1R
Suppose your session maximum drawdown is $350.
Your session drawdown is:
3.5R
Now imagine your account size changes, but your risk model remains consistent.
The session comparison remains meaningful.
You can build a dataset such as:
Monday: 1.2R
Tuesday: 2.1R
Wednesday: 0.8R
Thursday: 3.4R
Friday: 1.7R
Average:
(1.2 + 2.1 + 0.8 + 3.4 + 1.7) ÷ 5
= 1.84R
Your average maximum session drawdown is therefore 1.84R.
That number can be extremely useful when designing your daily stop.
Your Daily Stop Should Not Be Chosen Randomly
Suppose your average maximum session drawdown is 1.8R.
Your 90th-percentile session drawdown is 3.2R.
Your worst historical session is 4.7R.
You now have a framework.
A daily stop at 1R may be too tight if your strategy regularly needs more than 1R of temporary adverse movement.
A 10R daily stop may be unnecessarily loose.
A limit somewhere around the upper part of your normal drawdown distribution may make more sense, depending on the strategy and account constraints.
The important point is that the number comes from your data.
Not from an arbitrary rule copied from another trader.
The Drawdown Budget
One of my preferred ways to think about session risk is through a drawdown budget.
Suppose your personal daily risk limit is 3R.
You start the day with:
Trade 1: -0.8R
Trade 2: +1.2R
Trade 3: -0.7R
Trade 4: -0.9R
Your closed P&L is:
-0.8 + 1.2 – 0.7 – 0.9 = -1.2R
You have 1.8R remaining till you hit your set daily limit.
But that does not mean you should automatically continue trading.
Your psychological state may have changed.
The market may have changed.
Your best setups may already have appeared.
And your remaining drawdown capacity may be less useful than it appears.
A drawdown budget is not permission to lose the entire amount.
It is a boundary.
The Session Drawdown Curve Matters
Do not only record the final maximum drawdown.
Record when the drawdown occurred.
Imagine two sessions, both of which have a maximum drawdown of 2%.
Session A:
+1.5%
+2.0%
+1.0%
+0.5%
-2.0%
+0.8%
Session B:
-2.0%
-1.0%
-0.5%
+0.5%
+1.2%
+2.0%
The maximum drawdown is similar.
The psychological experience is completely different.
Session A gave the trader profits first and then forced a large giveback.
Session B began badly and required recovery.
Those two patterns can produce very different decision errors.
This is why the path of drawdown matters, not just the final number.
Peak-to-Trough Drawdown vs Starting-Balance Loss
Here is another common mistake.
Suppose you start with $10,000.
You make $500.
Your equity reaches $10,500.
Then you fall to $10,200.
Your starting-balance loss is zero because you are still profitable.
Your peak-to-trough drawdown is:
$10,500 − $10,200 = $300
That $300 represents the capital you gave back from your best point.
If this happens repeatedly, you may have a strategy that makes money but has poor profit retention.
That is a different problem from a strategy that loses money.
The solution may involve better exit management rather than better entries.
Drawdown Can Reveal an Exit Problem
Suppose your session statistics show:
Average session peak: +2.4R
Average session closing result: +0.7R
Average maximum drawdown after peak: 1.3R
That is interesting.
Your entries may be fine.
Your strategy is generating favorable movement.
But you are giving back a significant portion of it.
You should investigate:
Are you holding winners too long?
Are you reversing after a good trade?
Are you trading after reaching your daily target?
Are you moving stops?
Do you increase position size following wins?
Here session decline transforms from a mere risk stat into a diagnostic tool.
Research: Why Session Timing Changes Drawdown Behavior
Intraday markets are not uniform throughout the day. Research by Takatoshi Ito and Yuko Hashimoto using electronic FX transaction data found significant intraday patterns in activity and return volatility. Their study found that volatility and market activity were positively related, while bid-ask spreads tended to be narrower during periods of greater activity.
For a day trader, the important point is not simply that volatility changes.
It is that your strategy is being tested under different market conditions as the session progresses.
A stop that survives a quiet period may be repeatedly challenged during a more active window.
A breakout strategy may thrive when participation increases, but struggle when the price becomes erratic.
Your average drawdown is therefore partly a property of your strategy and partly a property of the environment in which you deploy it.
That is why session-level statistics are more informative than a single monthly drawdown figure.
Research from the Bank for International Settlements also shows the importance of London and New York in global FX activity, with liquidity typically highest around the London open and the London/New York overlap.
The practical lesson is simple:
Session labels are not just time labels. They are different liquidity and volatility environments.
Your drawdown data should reflect that.
Drawdown Is Also an Execution Statistic
A trader may blame strategy quality for a large session drawdown when the real issue is execution.
Imagine your backtested setup normally experiences 0.8R of adverse movement.
Live trading shows 1.4R.
Before changing the strategy, investigate:
Spread
Slippage
Entry delay
Partial fills
News exposure
Trading with low liquidity execution at session change
The market might not invalidate your setup.
Your live execution may simply be worse than the assumptions behind the strategy.
This is critical for big economic releases.
DayTradersDiary.com’s article on assessing news volatility before entry is a handy framework to separate typical volatility from event-driven circumstances.
If your worst session drawdowns cluster around CPI, NFP, FOMC, or other major releases, do not treat those sessions as ordinary observations.
They may belong to a separate volatility regime.
Build a Session Drawdown Database
You do not need an elaborate institutional system.
A spreadsheet is enough.
For every trading session, record:
Date
Instrument
Session
Starting equity
Highest equity
Lowest equity after the peak
Closing equity
Maximum session drawdown
Drawdown percentage
Drawdown in R
Number of trades
Number of losing trades
Largest losing trade
Maximum consecutive losses
Session return
MAE
MFE
News exposure
Execution quality
Primary drawdown cause
The final field is particularly important.
Classify the drawdown.
Was it:
Normal strategy variance?
Poor entry?
Poor exit?
Overtrading?
Oversizing?
News volatility?
Low liquidity?
Emotional choice?
The challenge of implementation?
In the absence of this classification, your data set informs you what happened, but not why.
Calculate Your Median Session Drawdown
The median is often more useful than traders expect.
Suppose ten sessions produce:
0.4%, 0.5%, 0.6%, 0.7%, 0.8%, 0.9%, 1.0%, 1.1%, 1.2%, 4.5%
The average is pulled upward by the 4.5% event.
The median sits around 0.85%.
This tells you that the ordinary session experience is very different from the extreme event.
But you should not simply ignore the 4.5%.
That extreme session is exactly what you need to investigate.
Was it a legitimate tail event?
Or did the trader violate the process?
This is one of the most important uses of distribution analysis.
Do not remove outliers until you understand them.
The 90th Percentile Can Become Your Practical Warning Level.
Suppose after 100 sessions, you discover:
Median drawdown: 0.7%
Average drawdown: 0.9%
90th percentile: 1.6%
Maximum: 3.4%
Now you can create a practical monitoring system.
Below 1%:
Normal.
1% to 1.6%:
Elevated.
Above 1.6%:
Investigate.
Above 2%:
Depending upon your regulations, you might want to consider ceasing or cutting exposure.
The exact thresholds should come from your own trading process.
The value is not in the numbers themselves.
The value is in having objective thresholds before emotions take over.
Session Drawdown and Trading Psychology
Drawdown changes how traders think.
At a small loss, most traders remain analytical.
After several consecutive losses, the internal objective often changes.
The trader stops asking:
“Is this a good setup?”
and starts asking:
“Can this trade get me back to breakeven?”
That is dangerous.
The market has no obligation to repair your previous trade.
A session drawdown, therefore, has a psychological component.
You need to write not simply the numerical drawdown but what happened to your decision-making as it rose.
Did you:
Do you trade a lot?
Come in early?
Size of bump ?
Stop?
Take the lower-quality setups?
Ignore your session cutoff?
Close winners prematurely?
These behaviors can explain why the final drawdown became much larger than your historical average.
The Drawdown Escalation Test
Here’s a useful test.
Divide your trades into three categories based on current session drawdown:
0 to 1R drawdown
1R to 2R drawdown
Above 2R drawdown
Then compare your execution quality.
You may discover something uncomfortable.
Perhaps your strategy performs well while you are down less than 1R.
But once you reach 2R, your average trade quality collapses.
That means your biggest problem may not be the strategy.
It may be your ability to execute the strategy under pressure.
That is a behavioral edge worth measuring.
Use the Position Size Calculator to Control Drawdown Before It Happens
Drawdown analysis tells you what has happened.
Position sizing helps control what happens next.
The logic is straightforward.
If your structural stop becomes wider, position size should generally become smaller if your dollar risk remains constant.
If session volatility expands, your normal position size may no longer be appropriate.
If your historical drawdown is approaching your predefined threshold, you may need to stop trading rather than reduce the stop distance.
This is where the Position Size Calculator becomes useful.
CME Group similarly emphasizes that position size should be determined from the logical stop location and the amount of account capital the trader is prepared to risk, rather than simply trading the maximum size available.
That principle is especially important when you are trying to control session drawdown.
Do not make the stop smaller because you want a larger position.
Make the position smaller because the trade requires a wider, structurally valid stop.
What Is Drawdown in a Trading Prop Firm?
This becomes even more important when you trade a proprietary trading evaluation or a funded account.
In a prop firm environment, drawdown is not merely an internal performance statistic.
It can be an account survival constraint.
There is an important difference between:
Your personal strategy drawdown
and
The firm’s permitted drawdown.
Suppose your strategy has an average maximum session drawdown of 1.4%.
That may be perfectly manageable in your personal account.
But if the account has a tight daily loss rule, a few consecutive losses, floating losses, and trading costs can bring you much closer to the firm’s limit than the average suggests.
This is why prop traders should measure drawdown in relation to the firm’s specific rule structure.
Daily Drawdown vs Maximum Drawdown in a Prop Firm
These are not the same thing.
A daily drawdown limit restricts how much equity you can lose within the firm’s defined daily measurement period.
A maximum drawdown limit controls the broader account-level loss boundary.
For example, The5ers‘ current High Stakes rules state a 10% maximum loss from the initial balance and a 5% daily drawdown based on the previous day’s closing equity or balance, with the calculation resetting at 00:00 UTC+3.
FTMO’s current 2-Step Challenge also lists a 5% Maximum Daily Loss and 10% Maximum Loss, while its daily-loss calculation incorporates equity, including open positions, commissions, and swaps.
The exact rules can change, and different programs calculate drawdown differently.
That is why traders should always read the current rules of the specific program rather than assuming every prop firm uses the same formula.
A Prop Firm Drawdown Example
Suppose you have a $100,000 evaluation.
The firm limits daily losses to 5%.
This suggests a daily limit of:
$100,000 × 5% = $5,000
Say your history stats are:
Average max session drawdown = $1700
90% = $3100
Maximum historical drawdown = $4,600
This changes how you should think about the account.
Your average drawdown is comfortably below the limit.
Your 90th percentile is still below it.
But your worst observed session is already close to the firm’s threshold.
That means your strategy may be viable, but your process has very little room for abnormal execution.
The correct response is not necessarily to increase the risk limit.
It may be to reduce your per-trade risk.
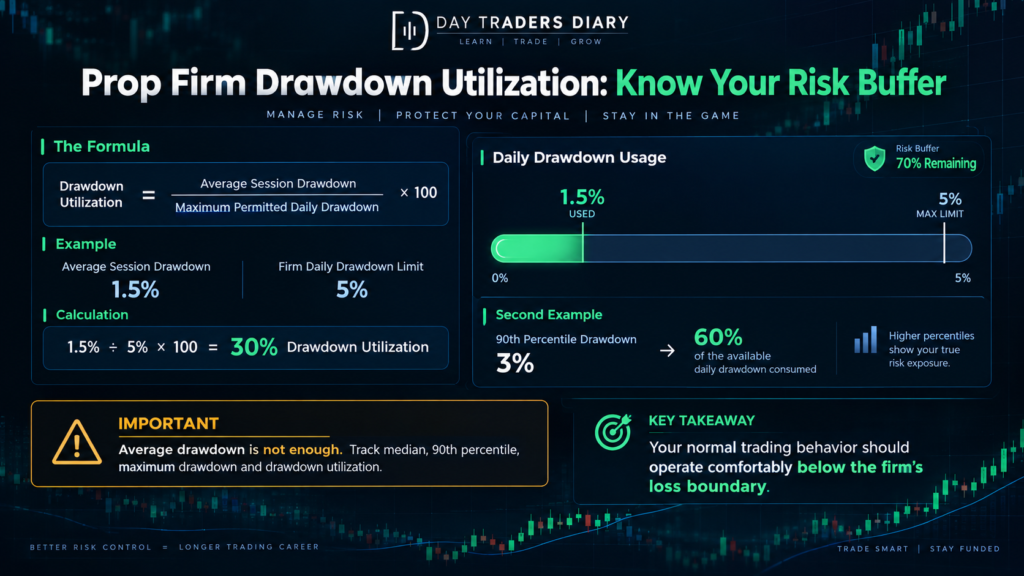
Calculate Drawdown as a Percentage of the Firm’s Allowed Drawdown
This is one of the most useful prop-trading metrics.
Formula:
Drawdown Utilization = Average Session Drawdown ÷ Maximum Permitted Daily Drawdown × 100
Suppose:
Average session drawdown = 1.5%
Firm daily limit = 5%
Then:
1.5 ÷ 5 × 100 = 30%
Your average session would take 30% of the daily drawdown available.
Now, let’s say your 90th percentile session drawdown is 3%.That consumes:
3 ÷ 5 × 100 = 60%
That is a much more meaningful statistic.
You may be profitable, but your strategy is consuming a large percentage of the available risk buffer.
The Hidden Danger of “Average”
Suppose a trader says:
My max daily drawdown is just 1%
Safe, that sounds.
But suppose:
80% of the sessions are under 1%.
15 percent to 2.5 percent.
4.8% to 5 per cent.
The mean can make the account appear safer than it actually is in terms of tail risk.
Prop firms care about the boundary.
Your risk model should too.
For that reason, serious prop traders should monitor:
Average drawdown
Median drawdown
90th percentile
Maximum drawdown
Drawdown utilization
Consecutive-loss drawdown
Floating equity drawdown
This creates a much more complete picture.
A Session Drawdown Framework for Day Traders
Here is the framework I would use.
Step 1: Define the Session
Choose the exact time window.
Do not simply write “London.”
Your broker’s server time, daylight-saving changes, and your own trading hours can affect the data.
A session should have a clearly defined start and end.
Step 2: Capture Starting Equity
Recorded is the account equity at the opening of the session.
This is your reference point.
Step 3: Track the Equity High
Record the highest equity achieved during the session.
This creates the session high-water mark.
Step 4: Track the Following Equity Low
Look for the lowest equity when a new high is made until another new high is made or until the session is over.
The largest peak-to-trough decline is your maximum session drawdown.
Step 5: Convert It Into a Percentage and R
Calculate:
Dollar DD
Percentage DD
R DD
Now you can compare different sessions.
Step 6: Classify the Cause
Was the drawdown normal?
Or was it caused by a process violation?
Step 7: Compare Across Sessions
Delete London, New York, Asian, overlap hours or whatever time frame you actually trade.
Step 8: Review the Distribution
Calculate average, median, 90th percentile, and max.
Now you have a real risk profile.
Example: 20 Trading Sessions
Suppose a trader records these maximum session drawdowns in R:
0.8, 1.2, 1.5, 0.7, 2.1, 1.0, 1.4, 2.5, 0.9, 1.3
1.1, 1.6, 0.6, 1.8, 2.0, 1.2, 0.9, 3.4, 1.5, 1.0
The average is approximately:
1.44R
But the maximum is:
3.4R
That immediately tells us something.
The trader normally experiences approximately 1.4R of maximum session drawdown, but there is a meaningful tail.
Next question:
What occurred on the 3.4R day?
If it was a true volatility shock, that is useful information.
If it involved revenge trading and increasing position size, it is a procedural failure.
Those two situations require completely different solutions.
Create a “Normal Drawdown” Range
You can also create a practical normal range.
Suppose your data show:
Median: 1.1R
Average: 1.4R
75th percentile: 1.7R
90th percentile: 2.2R
Maximum: 3.4R
You might classify:
Up to 1.7R: normal
1.7R to 2.2R: elevated
2.2R to 3R: unusual
Above 3R: investigation required
Again, they are not universal cut-offs.
They’re a good example of how you take historical performance and convert it into a live decision framework.
When Average Session Drawdown Starts Falling
This is an underappreciated performance signal.
Traders usually focus on increasing average profit.
But a reduction in average drawdown can be equally important.
Let’s say your monthly data goes from:
Average return per session: +1.1%
Average drawdown per session: 1.8R
Average profit a session: +1.0%
Average drawdown per session: 1.1R
Profitability, at first sight, changed little.
But the second version may be much easier to scale.
The trader is generating almost the same return while exposing significantly less capital to adverse movement.
That is an improvement in efficiency.
When Drawdown Rises Before Profitability Falls
This can be an early warning signal.
Suppose your normal statistics are:
Average return: +0.8R
Average drawdown: 1.2R
Then gradually:
Average return: +0.7R
Average drawdown: 1.6R
Then:
Average return: +0.5R
Average drawdown: 2.1R
Your profitability has deteriorated, but the more interesting change may be the drawdown expansion.
Something has changed.
Perhaps market conditions.
Perhaps execution.
Perhaps strategy drift.
Perhaps trader behavior.
Drawdown can therefore act as an early-warning indicator before your monthly P&L becomes obviously poor.
Journaling: Turn Drawdown Into Feedback
This is where your trading journal becomes more than a record of entries and exits.
The Forex Trading Journal guide explains why the journal should capture decisions and execution, not simply wins and losses.
For session drawdown analysis, add fields for:
Session start equity
Session high
Session low
Maximum peak-to-trough drawdown
Drawdown %
Drawdown in R
Max drawdown ahead of trade count
Back to back losses
Largest position
Session volatility
News exposure
Reason for drawdown
Emotional state
Process violation
Recovery after drawdown
That last field is particularly valuable.
A trader who regularly experiences a 2R drawdown but recovers without changing behavior may have a very different psychological profile from a trader who reaches 1R and immediately begins revenge trading.
Use the Trade Journal Template as a Performance Dataset
The goal is not to spend 30 minutes filling out a journal after every trade.
The goal is to collect enough structured information that your future decisions are based on your own evidence.
The downloadable Trade Journal Template can serve as the foundation.
Add session-level fields rather than recording only individual trades.
After 20 sessions, review.
After 50, review again.
After 100, start looking for stable distributions.
You are trying to answer:
What does my normal drawdown actually look like?
Not:
What drawdown should a trader theoretically have?
A Drawdown Review Routine
At the end of each session, answer five questions.
What was the maximum peak-to-trough drawdown?
When did it occur?
What caused it?
Was it within my historical range?
Did my behavior change as the drawdown increased?
The last question is often the most revealing.
If the answer is yes, you have identified a behavioral risk variable.
Scaling: Why Drawdown Matters More Than Account Size
This becomes important when traders start thinking about funded accounts.
A trader may have an excellent entry model.
A strong win rate.
A positive expectancy.
But if the account is too small, the dollar return may be insignificant.
The obvious temptation is to jump into a much larger account.
That is where many traders make a mistake.
Scaling capital does not fix poor drawdown control.
It magnifies the financial consequences of poor drawdown control.
A professional evaluation account can make sense when the trader already has evidence that the process works and wants access to more capital without simply depositing a much larger amount personally.
But the evaluation should be treated as a process test, not a lottery ticket.
The5ers as a Professional Scaling Pathway
The5ers is one example of a firm that structures an evaluation around defined drawdown boundaries.
Its current High Stakes program lists a 10% maximum loss and 5% maximum daily drawdown, alongside its evaluation targets and other trading conditions.
FTMO offers another model. Its current 2-Step Challenge lists a 10% maximum loss, 5% maximum daily loss, four minimum trading days, and an unlimited trading period.
These programs are structured differently, so the correct comparison is not simply account size.
Look at:
Daily drawdown calculation
Maximum drawdown
Whether the limit is static or trailing
How floating P&L is treated
Reset time
News rules
Position restrictions
Payout conditions
Consistency requirements
Your strategy needs to fit the rules.
That is the professional way to approach funded trading.
Your Average Drawdown Should Be Far Below the Account Limit
This is perhaps the most important point in the entire article.
If your average session drawdown is 4% and the firm’s daily loss limit is 5%, your strategy is operating dangerously close to the boundary, even if it remains technically compliant.
You do not want your normal behavior to live near the account’s failure threshold.
The objective should be to create a substantial buffer.
If the firm allows 5% daily drawdown, you do not need to prove that you can lose 4.9% and survive.
You need to prove that your strategy normally operates nowhere near that boundary.
That is what makes scaling sustainable.
The Professional Scaling Question
Instead of asking:
“How large an account can I get?”
Ask:
“How much drawdown does my process have to take to make its edge?
That alters everything now.
Suppose your data show:
Average session DD: 1.1R
90th percentile: 2.0R
Maximum: 3.0R
Average return: +0.9R
You now have a measurable trading process.
You can calculate how that process behaves under different capital levels.
That is far more useful than simply choosing the largest account advertised by a prop firm.
A Practical 30-Session Challenge
For the next 30 sessions, do not change your strategy to improve the numbers.
Measure it.
For each session, record:
Starting equity
Highest equity
Lowest equity after each peak
Maximum drawdown
Drawdown percentage
Drawdown in R
Number of trades
Maximum consecutive losses
Session return
Session
News exposure
Primary drawdown cause
Then calculate:
Average DD
Median DD
90th-percentile DD
Maximum DD
Average DD by session
Average DD by setup
Average DD after consecutive losses
Average DD on news days
At the end of 30 sessions, you will know considerably more about your trading process than you would from another month of staring at your win rate.
What Your Drawdown Data Should Eventually Tell You
A good drawdown dataset should answer five questions.
How deep does my strategy normally go against me?
This determines whether your stop and position size are compatible with actual market behavior.
Which session creates the most drawdown?
This helps determine where your strategy is most vulnerable.
What causes abnormal drawdown?
This separates market variance from trader mistakes.
How much of the permitted risk am I consuming?
This becomes crucial for prop firm trading.
What happens psychologically as drawdown increases?
This identifies behavioral weaknesses that ordinary statistics miss.
Once you have those answers, drawdown stops being a number you fear.
It becomes a measurement tool.
Frequently Asked Questions
What is the average drawdown per session?
Average drawdown per session is the average of the maximum peak-to-trough drawdown recorded across multiple trading sessions.
The basic formula is:
Average Session Drawdown = Sum of Maximum Session Drawdowns ÷ Number of Sessions
For example, five sessions with maximum drawdowns of $100, $150, $200, $120 and $180 produce an average session drawdown of $150.
What is the formula for average drawdown in percentage terms?
Use:
Average Session Drawdown % = Average Maximum Session Drawdown / Reference Equity x 100
To be consistent in your comparisons, use session starting equity or some other explicitly specified baseline.
What is the difference between drawdown and loss?
A loss usually describes a bad trade or a bad period result.
Drawdown is the relative distance from a prior stock peak.
A trader can close out a session in profit, and have a large intraday drop.
What is the maximum session drawdown?
The maximum session drawdown is the biggest fall from peak to trough of account equity within a specified trading session.
For example, if equity goes to $10,500 at one time and then later goes to $10,200, the maximum drawdown from that peak is $300.
Should I calculate drawdown from balance or equity?
For active day trading, equity is generally more informative because it captures floating profit and loss.
This becomes particularly important when evaluating prop firm rules because many firms use equity, including open-position P&L, when calculating daily or maximum loss limits. FTMO’s current rules, for example, explicitly include open positions, commissions, and swaps in equity for its Maximum Daily Loss calculation.
What is a good average session drawdown?
There is no universal number.
A good drawdown level depends on your strategy, expected return, account size, risk per trade, and external account rules.
A better question is whether your average and high-percentile drawdowns are comfortably below your maximum permitted loss.
How should day traders use drawdown data?
Use it to adjust position sizing, session selection, daily stop levels, trade frequency, and psychological rules.
Drawdown should also be analyzed by setup and session rather than treated as one large account-wide statistic.
What is drawdown in a trading prop firm?
Prop firm drawdown is the decline in account equity or balance that counts toward the firm’s loss limits.
Depending on the firm and program, this may include daily loss limits, maximum loss limits, trailing drawdown, or other calculations.
The exact calculation matters more than the advertised account size.
Is average drawdown enough to evaluate a prop firm strategy?
No.
You should also examine median drawdown, 90th-percentile drawdown, maximum drawdown, consecutive-loss drawdown, and drawdown utilization relative to the firm’s permitted limit.
Why is my average drawdown increasing even though my win rate is stable?
Possible reasons could be bigger positions, bigger stops, changing market volatility, worse execution, more trades, worse setups or behavioral changes following losses.
A stable win rate does not guarantee stable risk.
Final Takeaway
The most useful thing about average session drawdown is that it changes the question you ask about your trading.
Instead of asking:
“Did I make money today?”
you start asking:
“How much adverse equity movement did I need to tolerate to make that money?”
That is a much more professional question.
A session that makes 1R with a 0.7R maximum drawdown is very different from a session that makes 1R after surviving a 4R drawdown.
The final P&L is identical.
The quality of the process is not.
Start measuring your session drawdown in dollars, percentage, and R.
Then separate it by session, setup, volatility regime, and trading behavior.
Calculate the average.
Calculate the median.
Calculate the 90th percentile.
Study the outliers instead of deleting them.
And most importantly, compare your normal drawdown with the amount of drawdown your account can actually tolerate.
If you trade a prop firm account, this becomes even more important. Your objective is not to operate close to the firm’s maximum loss threshold. Your objective is to build enough statistical and psychological buffer that ordinary variance never comes close to threatening the account.
For your next 30 sessions, make one change to your journal:
Record maximum peak-to-trough session drawdown alongside every session’s final P&L.
Then look at the relationship.
You may discover that your biggest performance problem is not finding better entries.
It may be controlling what happens between your best trade of the session and your final trade.
That is where drawdown analysis becomes genuinely useful.
Next read: After measuring session drawdown, study How To Quantify News Volatility Before Entry to understand how changing volatility conditions can alter your normal risk profile.