
It was a great breakout.
Price broke resistance, volume picked up, candle closed strong, and you entered looking for continuation.
Then the market sold off.
Not a little.
It retraced almost the entire breakout, stopped you out, and then continued in the original direction without you.
This is one of the most frustrating situations in day trading because the analysis can be correct even when the entry is wrong.
The problem is usually not that the trader failed to identify the breakout.
The problem is that they had no model for how much retracement was normal after the breakout.
They treated the first pullback as evidence that the breakout had failed.
That is a costly mistake.
A breakout is not a single price event. It is a transition from one area of accepted trading to another. During that transition, the market often revisits the breakout area to test whether buyers or sellers are actually willing to defend the new price zone.
The objective is therefore not to predict the exact retracement level.
It is to estimate a probable retracement zone, define what would still be normal, and identify the point where a pullback has become a genuine reversal.
That distinction is the foundation of this article.
If you are trying to estimate retracement in Forex or other active markets, this framework gives you a more practical approach than simply drawing Fibonacci levels and hoping the price reacts at 38.2%, 50%, or 61.8%.
A Retracement Is Not Automatically a Failed Breakout
The first psychological error is easy.
Traders anticipate an immediate continuation of a powerful breakout.
They see a falling price as weakness.
But markets rarely move in a straight line.
Consider a resistance level at 1.0850.
EUR/USD breaks through it and trades to 1.0880.
The trader expects 1.0900 next.
Instead, price returns to 1.0860.
The inexperienced trader thinks:
“The breakout is failing.”
The experienced trader asks:
“Is this a normal retest, or is the market losing acceptance above 1.0850?”
Those are completely different questions.
If 1.0850 becomes support and buyers step in around 1.0860, the pullback may be healthy.
If the price collapses through 1.0850 and begins to accept bids below it, the breakout thesis will deteriorate.
The distance of the retracement matters.
But where the retracement occurs and how the price behaves there matter more.
What Research Tells Us About Retracements
There is an important reason to be careful about treating any single retracement percentage as a universal rule.
Research on financial market price dynamics shows that trend-following and contrarian behavior can coexist and shift depending on market conditions and time horizon. Andersen, Gluzman, and Sornette’s research on technical market patterns found that different trading behaviours can dominate in different market phases, rather than a single fixed pattern working consistently across all conditions.
That is highly relevant to breakout retracements.
A pullback during a strong directional trend is not the same statistical environment as a pullback inside a range.
Research on foreign-exchange order flow from the BIS also found that order flows contain information about future exchange rates.
For a day trader, the practical interpretation is important.
Price does not retrace simply because it reached a Fibonacci number.
It retraces due to the balance among aggressive buyers, sellers, liquidity, profit-taking, and changes in positioning.
The BIS has also documented how changes in FX market liquidity affect the market’s ability to absorb order-flow imbalances without substantial price changes.
This explains why the same technical breakout can produce a 20-pip retracement one day and a 60-pip retracement another day.
The underlying liquidity conditions are different.
That is why a useful retracement model must include volatility and market structure.
The Real Question: How Deep Should the Pullback Be?
There is no universal retracement percentage.
Instead, think in terms of probability zones.
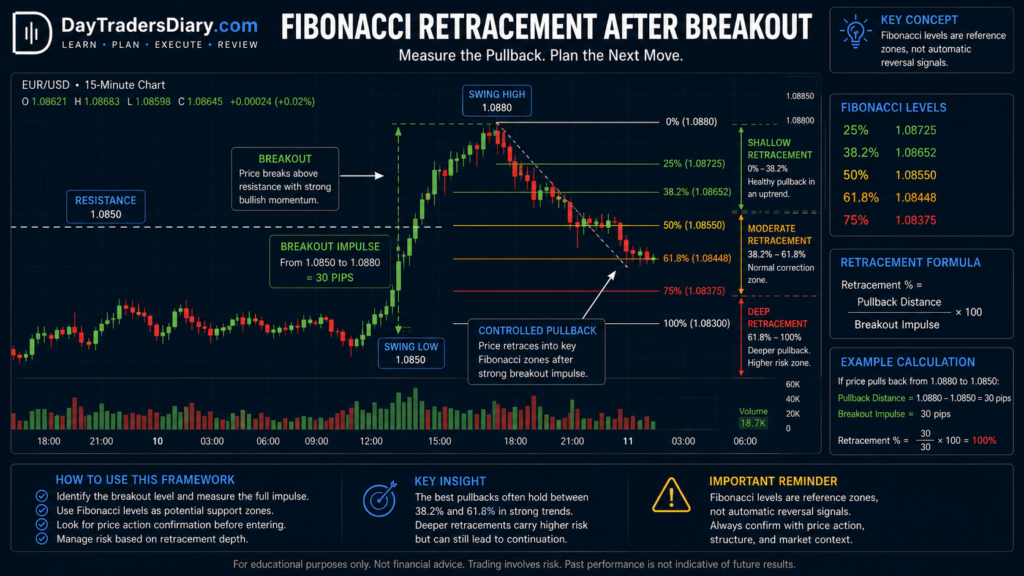
For a bullish breakout, you can divide the initial breakout move into three broad areas:
A shallow retracement.
A normal retracement.
A deep retracement.
The exact percentages should come from your instrument and strategy rather than being treated as universal laws.
But for a practical start you may think of a retracement of about 20% to 35% of the breakout impulse as shallow, 35% to 60% as moderate and 60% to 80% as profound.
Those ranges are not trades signs.
They are measurement zones.
The critical point is that a 50% retracement is not automatically bearish.
If the original breakout was extremely strong, a 50% retracement can still be perfectly healthy.
If the breakout was weak and barely cleared resistance, even a 30% retracement may be a warning.
The quality of the breakout determines how much retracement it can reasonably tolerate.
Start With the Breakout Impulse
Before estimating the retracement, measure the breakout itself.
Suppose EUR/USD breaks resistance at 1.1000.
It reaches 1.1040.
The initial impulse is 40 pips.
Now you have a reference unit.
A 25% retracement equals 10 pips.
A 50% retracement equals 20 pips.
A 75% retracement equals 30 pips.
But this is only the mathematical starting point.
Now add in the market context.
If the breakout occurred after three hours of compression, on expanding volume or high momentum, and with a clean close above resistance, expect buyers to defend pretty early.
If the breakout occurred after an already extended 150-pip rally, the same 40-pip breakout may be much more vulnerable to a deeper retracement.
The impulse cannot be separated from the move that created it.
Measure the Pre-Breakout Range
One of the most overlooked variables is the size of the consolidation before the breakout.
Suppose a market has spent two hours inside a 20-pip range.
It breaks upward and travels 40 pips.
That breakout has moved two times the pre-breakout range.
Now compare that with a market that was already moving aggressively higher before breaking another minor resistance level.
The second breakout may be much less meaningful.
This gives us an important concept:
Breakout strength is relative to the structure that preceded it.
A breakout that escapes a compressed range has more room to develop than a breakout that extends an already stretched trend.
The Breakout Expansion Ratio
You can quantify this.
Call it the Breakout Expansion Ratio.
The formula is:
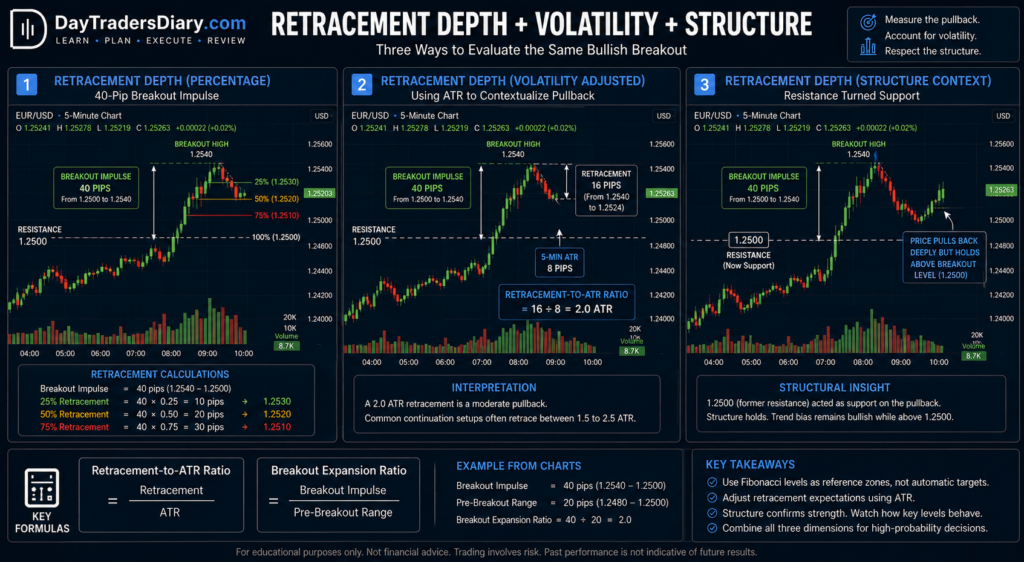
Breakout Expansion Ratio = Breakout Impulse ÷ Pre-Breakout Range
For example:
Pre-breakout range = 20 pips
Breakout impulse = 40 pips
Expansion ratio = 2.0
Now suppose a different arrangement:
Range before break out = 50 pips
Breakout impulse = 30pts.
Blow-down ratio = 0.6
The initial breakout is a much larger growth compared to the preceding structure.
That does not guarantee continuation.
But it gives you useful context for estimating how much retracement the move can tolerate.
ATR Gives You a Second Reference
The breakout impulse tells you what the market just did.
ATR tells you what the market normally does.
You want both.
Suppose EUR/USD has a 5-minute ATR of 8 pips.
The breakout travels 40 pips.
The breakout has therefore moved approximately five times the normal five-minute ATR.
That is a significant expansion.
A subsequent 15-pip retracement may look large emotionally.
Statistically, it may be completely ordinary relative to the volatility that just occurred.
This is one of the most important lessons when learning how to identify retracement in Forex.
Never evaluate a pullback only in percentage terms.
Evaluate it in volatility-adjusted terms as well.
Retracement-to-ATR Ratio
You can calculate:
Retracement-to-ATR Ratio = Retracement Distance ÷ ATR
Suppose:
Retracement = 16 pips
5-minute ATR = 8 pips
Retracement-to-ATR Ratio = 2.0
The pullback is two ATR units.
Now compare that with a 5-pip pullback in an instrument with a 10-pip ATR.
That is only 0.5 ATR.
The second pullback is much smaller relative to normal market movement.
This metric becomes especially useful when comparing trades across different days.
The Most Important Level Is Often the Breakout Level
Traders frequently focus too much on the percentage retracement and not enough on the original level.
Suppose resistance sits at 1.2500.
Price breaks to 1.2530.
Then pulls back to 1.2510.
That is a 67% retracement of the 30-pip impulse.
A Fibonacci trader might call this dangerously deep.
But price is still above 1.2500.
The market may be testing the old resistance.
Now imagine price pulls back only 30% of the move but trades below 1.2500.
The percentage is smaller.
The structural damage is greater.
This is why I prefer structure before percentage.
A retracement percentage tells you how much of the move has been given back.
The breakout level tells you whether the market is still accepting the new price area.
The Retest Zone Is More Useful Than a Single Price
Do not expect the breakout level to behave like an exact line.
Markets trade through zones.
If resistance was around 1.2500, a healthy retest might temporarily trade at 1.2498 or 1.2502 before buyers step in.
This is how stops immediately beyond visible levels might be vulnerable.
The market may test a little above that and still not invalidate the larger breakout.
When assessing retracement, consider in terms of zones, not prices.
This, too, is consistent with the core values of support and resistance. Market levels are zones where the market’s behavior shifts, not guarantyd turning moments. Research and market education on support and resistance also highlights that price can move thru a level before reverting. Stronger levels tend to be derived from more significant historical structure.
Retracement vs Pullback in Trading
The terms are often used interchangeably, but it is useful to make a practical distinction.
A pullback is a temporary countermove against the current direction.
A retracement describes the amount or proportion of that countermove.
Or, simply put,
The event is called the Pullback.
The retracement is the depth.
There is a useful distinction for journaling .
You may record:
Price retreated 18 pips.
Then:
“The pullback retraced 45% of the breakout momentum.”
That is much more useful than simply writing “normal retracement.”
Retracement vs Reversal
This is where traders lose the most money.
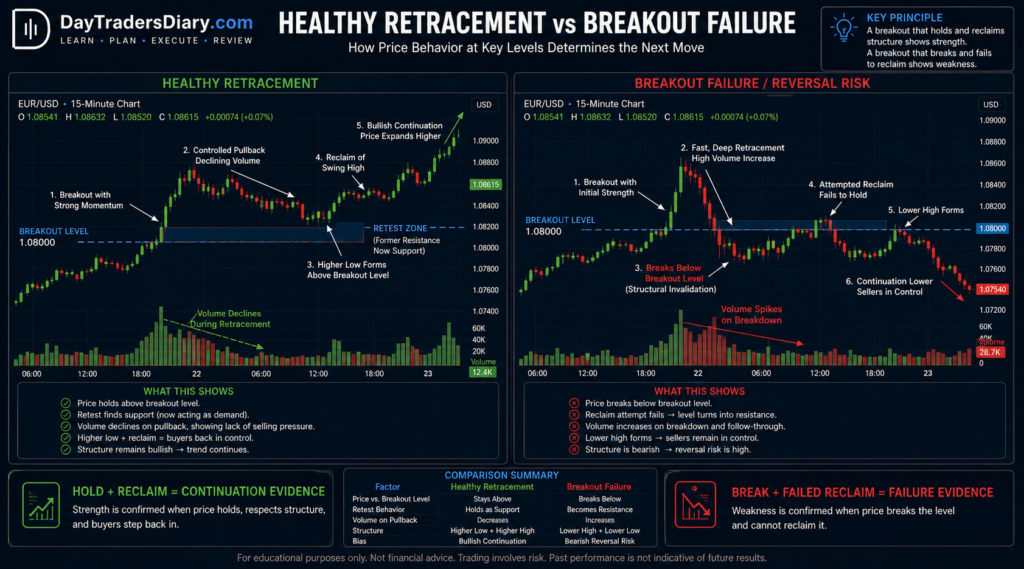
A retracement and reversal can look identical at the beginning.
Price breaks upward.
Price pulls back.
You do not know yet whether the market is simply testing support or beginning a new downtrend.
The difference emerges through structure.
A bullish retracement generally preserves some combination of:
The breakout level.
Higher lows.
Demand response.
Positive momentum.
Acceptance above the prior resistance.
A reversal begins to show:
Failure to hold the breakout zone.
Lower highs.
Loss of the prior swing structure.
Increasing downside momentum.
Acceptance below is an important support.
The keyword is acceptance.
One spike below a level is not necessarily a reversal.
Repeated trading below it with failed attempts to reclaim it is much more significant.
A Better Way to Estimate Retracement
“I work in a five-part framework.
First measure the breakout pulse.
Second, calculate the typical volatility.
Third, examine the breakout quality.
Fourth, discover structural support in the impulse.
Fifth, observe the price behavior when it gets to those places.
This results in a retracement map, rather than a single prediction.
Step One: Measure the Impulse
Suppose resistance is 1.0800.
Price breaks to 1.0840.
Impulse = 40 pips.
Mark:
25% = 10 pips
50% = 20 pips
61.8% = approximately 24.7 pips
75% = 30 pips
These become reference points.
They are not automatic entries.
Step Two: Measure the Volatility
Suppose a five-minute ATR is 9 pips.
The 40-pip impulse equals approximately 4.44 ATR.
That is a strong expansion.
A 20-pip retracement equals roughly 2.22 ATR.
Now you can judge the pullback in two ways.
It retraced 50% of the breakout.
It also moved more than two times the normal five-minute ATR.
That is a meaningful pullback.
But it still may not invalidate the breakout.
Step Three: Grade the Breakout
This is where most retracement models are incomplete.
Give the breakout a quality assessment.
Did compression precede the breakout?
Did volume expand?
Did the price close near the breakout candle’s extreme?
Did multiple candles hold above the level?
Was the move aligned with the higher timeframe trend?
Did the breakout occur during active market hours?
The stronger the answers, the more confidence you can have that deeper pullbacks will hold.
Not because strong breakouts cannot retrace.
Strong breakouts have demonstrated more evidence of acceptance.
Step Four: Map Structural Supports
Now, forget about Fibonacci percentages for a bit.
The real price structure is there.
Where was the last higher low ?
Where were the old buyers when defending!
When did the breakthrough start to accelerate?
Where is the midpoint of the consolidation?
Where is VWAP or another contextually relevant reference?
Where is the previous day’s high or low?
If one of these levels lies near the 38%-50% retracement zone, the area becomes more interesting.
This is confluence.
The Fibonacci level itself is not the reason for the trade.
It helps you measure the location of the pullback.
Step Five: Observe the Reaction
This is the step that turns analysis into execution.
Let’s say the price hits the 50% retracement.
Don’t buy on impulse.
Watch.
Are sellers backing off?
Does the range of candles shrink?
Is pricing making a higher low?
Does volume change?
Does price take back a short term swing?
Does the next candle produce directional follow-through?
Now you have evidence.
You are no longer buying a number.
You are trading a reaction at a pre-defined zone.
Why Fibonacci Can Be Useful Without Treating It as Magic
Fibonacci retracement levels are popular because they provide standardized reference points.
That can be useful.
But I would never tell a trader that price “must” retrace 61.8%.
There is no universal law requiring it.
Recent work on technical indicator models also highlights a more general difficulty . Indicators can enhance models in some contexts , but have out-of-sample and regime generalization concerns . Raw price-based features can still be more effective in high-frequency applications .
This is how Fibonacci should be treated.
It’s a framework of measurement.
Not a prediction engine.
Now, if the 61.8% coincides with the old breakout level, a higher timeframe swing and a volatility adjusted support region, it is more interesting.
If 61.8% sits in the middle of the empty price space, I care much less.
The “Retracement Quality” Test
One of the most useful concepts is to evaluate how price retraces, not simply how far.
Imagine a breakout travels 50 pips.
Then the price retraces 20 pips.
That sounds like a big deal.
But what if the 20 pip pullback is comprised of a series of minor overlapping candles with decreasing volume.
That could be a sign of disciplined profit taking.
Now think of the same 20 pip retracement, but this time thru 3 massive bearish candles with increasing volume.
That is different.
Same distance.
Different information.
This is why a fixed retracement percentage is incomplete.
Slow Retracement vs Fast Retracement
A slow retracement often indicates that the opposing side is gradually absorbing the move.
A violent retracement can indicate aggressive counter-order flow.
Neither is automatically bullish or bearish.
But they should be interpreted differently.
Suppose EUR/USD breaks resistance and rises 30 pips over ten minutes.
It then gives back 15 pips over twenty minutes.
That is relatively slow.
Now imagine it gives back 15 pips in thirty seconds.
The market structure may look identical on a static chart.
The information is not identical.
Speed matters.
This becomes even more important on lower timeframes.
Retracement Velocity
You can quantify this, too.
Retracement Velocity = Retracement Distance ÷ Retracement Time
Suppose the price gives back 15 pips in 10 minutes.
Velocity = 1.5 pips per minute.
Another setup gives back 15 pips in 60 seconds.
Velocity = 15 pips per minute.
The second retracement is moving ten times faster.
That should influence your interpretation.
A fast retracement through the breakout level deserves much more caution than a slow, controlled pullback that remains structurally bullish.
The Failed Retest
One of the strongest warning signs is a failed retest.
Price breaks resistance.
Pulls back.
Touches the old resistance.
Bounces.
Then returns.
This time, buyers cannot push the price higher.
Price breaks below the retest low.
That is a change in structure.
The original breakout may be losing acceptance.
This is where the distinction between retracement and reversal becomes practical.
You do not need to predict the reversal.
You wait for the market to demonstrate that the bullish structure is deteriorating.
A Worked Forex Example
Suppose GBP/USD trades inside a 30-pip range.
Resistance is 1.2700.
The market has tested 1.2700 four times.
Price finally breaks to 1.2735.
Breakout impulse: 35 pips.
ATR (5m) is 7 pips.
Range vs. breakout growth:
35 ÷ 30 = 1.17.
Reference points for retracement are:
8.75 pips = 25%
13.37 pips = 38.2%
61.8% = 21.63 pips
75% = 26.25 pips
Now price pulls back to 1.2720.
That is a 15-pip retracement.
Percentage retracement:
15 ÷ 35 = 42.9%.
At first glance, that looks fairly deep.
But price is still 20 pips above the breakout level.
More importantly, the pullback reaches the area around 1.2720 and begins forming higher lows.
The trader should not automatically exit simply because the retracement exceeded 38.2%.
The market has not invalidated the breakout.
Now change the scenario.
Price falls to 1.2695.
The retracement is approximately 40 pips.
The market has now moved below the original breakout level.
It attempts to reclaim 1.2700 and fails.
Now the problem is no longer the percentage.
The problem is failed acceptance.
The information has changed.
Use the Breakout Origin as a Hard Reference
One of my preferred rules is simple:
The deeper the retracement, the more important the breakout origin becomes.
If the price remains above the breakout origin, continuation remains plausible.
If price returns to the origin, the market is testing the entire breakout thesis.
If the price breaks below the origin and then falls, the probability of a failed breakout increases.
This gives you a much more useful hierarchy:
Retracement percentage tells you depth.
ATR tells you about the abnormality.
Structure tells you validity.
Acceptance tells you whether continuation remains credible.
Don’t Confuse a Deep Retracement With a Weak Market
This is especially true for Forex.
Even in strong trends currency pairings can have substantial pullbacks as liquidity is spread across worldwide sessions and market players.
The BIS research on FX liquidity and order flow demonstrates why order-flow imbalances and liquidity conditions can materially influence price movement.
So a 60% retracement does not automatically mean the trend is over.
You need to ask whether the market has actually changed structure.
Estimate the Expected Retracement From Historical Data
If you want to move beyond discretionary estimates, build a database.
Take 100 or more breakouts from the same instrument and setup.
Measure:
Size at breakout initiation.
Pre breakout range.
Volume or tick volume condition.
How deep is the retracement.
Retracement length
Maximum pullback before continuation.
Whether the breakout eventually succeeded.
Whether the breakout failed.
Time of day.
Higher timeframe trend.
Then calculate the distribution.
You might discover that:
25% retracements occur very frequently.
50% retracements are common.
75% retracements often precede failure.
But you may also discover that strong opening-session breakouts behave differently from midday breakouts.
That is where the real edge begins.
The Median Retracement Is More Useful Than Your Favourite Fibonacci Level
Suppose you analyze 100 successful bullish breakouts.
The maximum retracement before continuation is:
Median: 34%
75th percentile: 48%
90th percentile: 63%
Now you have something much more useful than saying:
Breakouts often retrace to 50%.
You might say:
“50% of our successful breakouts pull back less than 34% before continuing, and 90% don’t pull back more than 63%.
That is a true trade statistic.
It can affect entry, stops, and expectations.
Conditional Retracement Statistics Are Better
Take the same database and separate the trades.
Strong breakout.
Weak breakout.
High volatility.
Low volatility.
Trend day.
Range day.
News event.
No-news environment.
Now the numbers may change dramatically.
Strong breakouts have a median retracement of 28%.
Weak breakouts have 47%.
That immediately tells you something.
The breakout quality itself helps predict the likely depth of the retracement.
The Breakout Quality Score
You can formalize this.
Create a simple internal score based on:
Breakout candle strength.
Volume expansion.
Pre-breakout compression.
Higher timeframe alignment.
Distance from major resistance or support.
Time of day.
Momentum persistence.
The score does not need to be mathematically perfect.
It needs to be consistent.
Then compare the score against eventual retracement depth.
Over time, high-quality breakouts typically experience shallower retracements.
That gives you a data-backed reason to distinguish them.
Risk Management: Your Stop Should Survive Normal Retracement
This is the direct link of the retracement analysis to risk.
Say your analysis shows that successful breakouts typically retrace 40% of the initial impulse.
You enter immediately at the breakout.
Then you place your stop at 20% retracement.
You have effectively designed a strategy that gets stopped by normal behavior.
This is one of the most common execution mistakes in breakout trading.
The trader identifies the correct direction but sets a stop-loss level that is inconsistent with the setup’s historical volatility.
You need to know the distribution before deciding on the stop.
Position Size Must Come After the Stop
Suppose your structural stop is set to 25 pips.
You are willing to risk $100.
Do not reduce the stop to 12 pips simply because you want a larger position.
Keep the structural stop.
Reduce the position.
This is where most traders miscalculate risk. A Position Size Calculator removes guesswork and allows you to translate the actual stop distance into an appropriate lot or share size.
The correct sequence remains:
Expected retracement → structural invalidation → stop distance → position size.
Not the other way around.
Reward-to-Risk Changes During a Retracement
There is another subtle issue.
Suppose a breakout entry gives you a target of 60 pips and a stop of 20 pips.
That is 3R.
Price then moves 25 pips in your favour and pulls back.
If you enter a second position during the retracement, your potential reward and risk are different.
You may now have:
Entry closer to support.
Smaller structural risk.
More remaining upside.
That can improve reward-to-risk.
But only if the retracement has actually stabilized.
Buying simply because the price has fallen does not create an edge.
You need evidence that the pullback is ending.
Entry Timing: Immediate Breakout vs Retracement Entry
There are two legitimate approaches.
The first is a breakout entry.
You enter as the price clears the level.
The advantage is participation.
The disadvantage is that you pay the highest price for certainty that the level has broken.
The second is a retracement entry.
You wait for the market to return toward the breakout area.
The advantage is a better price and smaller structural risk.
The disadvantage is that some breakouts never retrace enough to provide an entry.
Neither approach is universally superior.
Your journal should tell you which works better for your strategy.
The Psychology of Waiting for the Retracement
Waiting is easy until the breakout starts to run without you.
The price breaks resistance.
It’s moved 15 pips .
You think to yourself:
“It’s gonna be 50.
Then 25 pips.
“Now I have to enter.”
Then 35.
You chase.
Price retraces.
You panic.
This is how traders turn a well-defined breakout strategy into emotional improvisation.
A better rule is to decide before the breakout whether you are a breakout-entry trader, a retracement-entry trader, or a hybrid.
If you are waiting for a pullback, accept that some trades will leave without you.
That is not a problem.
It is the cost of your entry model.
The Hybrid Entry Model
One useful approach is to divide the position.
For example, you might take a smaller initial position once the breakout is confirmed.
Then reserve additional risk for a retest.
This can reduce the psychological pressure to chase.
But there is a major warning.
Do not use scaling to hide a bad entry.
The total planned risk should be defined before the trade.
If the breakout fails, the combined position should remain inside your maximum risk limit.
When the Retracement Becomes Too Deep
There is no universal invalidation percentage.
But your own statistics can create one.
Suppose your historical data shows that 95% of successful breakouts do not retrace more than 72% of the impulse.
Then, a move beyond 72% could serve as a warning threshold.
Not an automatic reversal signal.
A warning.
If the price also breaks the breakout origin and fails to reclaim it, the evidence becomes much stronger.
This is much better than saying:
“Anything beyond 61.8% is a reversal.”
Markets do not work that cleanly.
Retracement Duration Matters
Depth is only half the story.
Time matters too.
A 30-pip retracement that takes 45 minutes can mean something different from a 30-pip retracement that happens in 60 seconds.
A slow retracement may represent orderly profit-taking.
A fast retracement may represent aggressive opposing order flow.
Therefore, record both:
Retracement depth
and
Retracement duration
Then calculate retracement velocity.
This gives you another dimension for separating healthy pullbacks from dangerous ones.
The Shape of the Pullback
Candle structure matters.
A controlled pullback often contains overlapping candles and decreasing momentum.
A reversal often produces expanding candles in the opposite direction.
Again, this is not a guarantee.
But it provides information.
Suppose the breakout candle travels 30 pips.
The retracement takes ten candles and gives back 15 pips.
That is relatively controlled.
Now, suppose three large bearish candles erase 25 pips.
The speed and structure of the retracement are more concerning.
You are looking for a behavior change, not just a percentage.
Volume Can Help Confirm the Retracement
Volume is particularly beneficial when the instrument is delivering good volume information.
Now imagine that break out on strong volume is bullish.
Then price falls back on falling volume.
That can be constructive.
It suggests the retracement is occurring without equivalent selling participation.
Now, imagine the breakout occurs on high volume, and the retracement also produces expanding volume.
That deserves more caution.
Volume does not tell you exactly what will happen.
But it can help distinguish a controlled pullback from an aggressive countermove.
This naturally connects to the DayTradersDiary.com framework for identifying fake breakouts using volume filters. A breakout that cannot hold its level while opposing volume expands should be treated very differently from one that retests the level on declining participation.
The Liquidity Sweep Problem
Sometimes, the price will deliberately or mechanically move beyond an obvious level before reversing.
For example:
Resistance = 1.3000.
Breakout = 1.3015.
Price briefly falls to 1.2995.
Then quickly recovers to 1.3020.
A trader with a stop at 1.3000 may be stopped even though the breakout remains valid.
This is why structural zones are more useful than exact lines.
The market may temporarily trade beyond a level without establishing acceptance there.
The key question becomes:
Did the price trade through the level, or did it fall below it?
That is the same distinction we use when identifying fake breakouts.
Retracement vs Reversal in Real Time
Here is the decision framework I would use.
Price breaks upward.
The first pullback begins.
If the price remains above the breakout zone, the trend remains intact.
If the price reaches a known structural level and produces a bullish reaction, the pullback may be ending.
If price breaks the structural level but immediately reclaims it, remain cautious rather than declaring a reversal.
If price breaks the level, fails to reclaim it, forms a lower high, and continues lower, the probability of reversal increases substantially.
Notice that no single candle makes the decision.
The evidence accumulates.
That is how experienced traders think about retracements vs. reversals.
A Retracement Map Before the Trade
Before entering a breakout, mark three areas.
The first is the shallow retracement zone.
The second is the main retest zone.
The third is the structural invalidation zone.
For example:
Breakout impulse = 40 pips.
Shallow zone = 10 to 14 pips.
Main retest zone = 16 to 24 pips.
Invalidation zone = around the breakout origin and prior structure.
Now you know what to expect.
When price pulls back, you are not improvising.
You are comparing actual behavior with the map.
Don’t Move Your Stop Because the Retracement Is Larger Than Expected
This is where many traders destroy otherwise good strategies.
They enter.
Price retraces.
It reaches their planned stop.
They widen it.
Price retraces further.
They widen again.
Eventually, the trade either recovers or produces a huge loss.
If your historical retracement distribution indicates the setup should tolerate 30 pips and your stop was only 15 pips, the solution is not to move the stop after entry.
The solution is redesigning the trade before entry.
That may mean waiting for a better entry, reducing size, or skipping the setup.
Journaling the Retracement Distribution
Your Trade Journal Template on DayTradersDiary.com can become much more powerful if you add retracement-specific fields.
Identify the breakout level.
In record breaking impulse.
Pre-breakout range record.
ATR record.
1st entry.
Maximum retracement before continuation.
Worst unfavorable expedition to date.
Record the retracement percentage.
Record retracement duration.
Record retracement velocity.
Record whether the breakout level held.
Record whether the trade continued or reversed.
Then separate the data by setup type.
After 50 trades, you may start seeing tendencies.
After 100, you may have enough information to establish meaningful probability ranges.
Maximum Retracement Before Continuation
This should become one of your most important statistics.
Call it MRC, or Maximum Retracement Before Continuation.
For each successful breakout, see how much the stock retraced before making the next significant continuation move.
Let us say your results are:
MRC, median 31%
75th percentile: 46%
90th percentile: 61%
That means most successful breakouts tolerate relatively shallow retracements, but a substantial minority experience deeper pullbacks.
Now you have a framework for entry and stop placement.
Build Separate Statistics for Long and Short Breakouts
Don’t assume bullish and bearish breakouts act the same.
Asymmetry can be created by market conditions.
Short breakouts during panic bouts may generate more faster continuations.
Pullbacks of bullish breakouts in strong risk-on settings may be distinct.
Track them separately.
Your best long setups typically retrace 35%, while your short setups often retrace only 25%.
That is valuable information.
Session Matters Too
A London-session breakout in EUR/USD is not necessarily comparable to a New York-session breakout.
The same is true for stocks at the opening bell versus midday.
Liquidity, participation, and volatility change.
So your database should include a session.
If the distribution differs significantly, build separate models.
This is how you move from generic trading advice to a strategy that actually belongs to you.
News Can Completely Distort Retracement Statistics
A breakout occurring five minutes before the CPI should not necessarily be treated the same as a normal technical breakout.
News can create abnormal volatility and liquidity conditions.
If you have read DayTradersDiary.com’s framework on quantifying news volatility before entry, you will recognize the connection.
A post-news retracement may be dramatically larger than your normal technical pullback.
That does not automatically mean the breakout failed.
It may mean your normal volatility model no longer applies.
The Scaling Question
Eventually, a trader who develops a measurable breakout-and-retracement edge may face a different constraint.
Capital.
You can have a positive expectancy strategy and excellent discipline while still being limited by the amount of capital you are willing to put at risk.
That is one reason serious traders sometimes investigate evaluation programs.
The important word is sometimes.
A funding evaluation should not be used to compensate for an untested strategy.
It can make more sense after you already know your historical retracement distribution, average R multiple, drawdown profile, and execution behavior.
The5ers currently offers its High Stakes program as a two-step evaluation with a 10% Step 1 profit target, a 5% Step 2 target, a 5% maximum daily loss, and a 10% maximum loss. The program also allows overnight and weekend positions and currently permits holding trades through news, while restricting order execution around certain high-impact releases.
Those rules matter for a breakout trader.
If your strategy relies on entering immediately around major news releases, execution restrictions on the evaluation may affect it.
If your trades are ordinary technical breakouts and you generally hold through normal market fluctuations, the rules may fit more naturally.
Other firms, including FTMO and Trade The Pool, use different evaluation structures and trading rules.
The point is not to choose the largest advertised account.
The point is to find an evaluation whose risk rules are compatible with the strategy you have already tested.
If your journal shows a recurrent breakout edge and you are able to stay disciplined within established drawdown limitations a The5ers evaluation can be seen as a professional track to scaling rather than a shortcut to avoid acquiring competence.
Your Edge Is Not the Fibonacci Level
This is worth repeating.
The edge is not:
“Price retraces to 61.8%.”
The edge is closer to:
“After a high-quality breakout from compression, during this session and volatility regime, the market typically retraces between 25% and 45% before continuation, while holding the breakout zone.”
That statement is testable.
The first one is mostly a belief.
Professional trading improves when beliefs become measurable hypotheses.
A Complete Retracement Estimation Process
Before entering a breakout, calculate the impulse size.
Determine the pre-breakout zone.
Calculate the current ATR on your time frame for execution.
Estimate breakaway expansion ratio.
Record the breakout point.
Identify support or resistance within the impulse.
Map shallow, moderate, and deep retracement zones.
Evaluate the quality of the breakout.
Consider the session and volatility regime.
Check for nearby news.
Then define what would prove the breakout invalid.
Now you have a plan.
If price retraces 30%, you know what that means.
If it retraces 50%, you know what to watch.
If it reaches 70%, you know that the setup is approaching the limits of its historical behavior.
You do not need to guess.
A Practical Trading Example
Imagine gold breaks a resistance level at 2,400.
The breakout travels to 2,420.
The initial impulse is $20.
Your five-minute ATR is $6.
The breakout is approximately 3.33 ATR.
You identify:
25% retracement = $5
38.2% = $7.64
50% = $10
61.8% = $12.36
75% = $15
Now, the price retraces to $2,410.
That is a 50% retracement.
A trader who unthinkingly follows Fibonacci may think the setup is becoming dangerous.
But the price is still $10 above the breakout level.
The retracement occurs on declining volume.
A higher low forms.
Price reclaims the short-term swing high.
The breakout remains structurally intact.
Now imagine the price continues to $2,404.
That is an 80% retracement.
Price then falls through $2,400.
It attempts to reclaim $2,400.
Fails.
Now the situation is different.
The issue is no longer that the market retraced 80%.
The issue is that the market has lost acceptance above the breakout level.
That is the information you should trade.
The Most Useful Mental Model
Think of the breakout as an auction into new territory.
The market needs to answer a question:
Are participants willing to transact at these new prices?
The initial breakout tests that question.
The retracement tests it again.
If buyers defend the old resistance, acceptance is developing.
If sellers push the price back below it and hold it there, acceptance has failed.
This mental model is more useful than memorizing a list of retracement percentages.
Frequently Asked Questions
How do you estimate a retracement after a breakout?
First, determine the impetus of breakout. Then compare the potential pullback against ATR, the range prior to the breakout, structural support and historical retracement data. Use 25%, 38.2%, 50%, 61.8%, 75% as reference zones, not as automatically reversing levels.
What is a normal retracement after a breakout?
There is no such thing as a normal retracement. It is contingent upon the instrument, time frame, volatility, quality of breakout, and market regime. In some cases the same 50% pull back can be healthy and in some it can be a failure.
How do you identify retracement in Forex?
Measure the size of the breakout impulse, identify the original breakout level, compare the pullback with the current ATR, and watch whether the price forms support above the breakout zone. The reaction at the level is usually more important than the exact percentage retraced.
What is the difference between retracement and reversal?
A retracement is a counter-move that does not damage the larger structure. When the market structure and acceptance alter considerably in the other direction, we call it a reversal. The discrepancy is often more obvious during price breaks and in the absence of reclaiming of structural levels.
What is the difference between a retracement and a pullback in trading?
The countermove is the pullback itself and retracement is how much of the price of the prior move is given back. For example the price may pull back 20 pips which is a 40% retracement of a 50 pip breakthrough.
Is a 50% retracement a good entry?
It can be but 50% level alone is not a good enough justification to get in. However, the level is more relevant when it is in line with the market structure, the breakout zone, the volatility conditions and a clear price reaction.
Is Fibonacci reliable for estimating retracement?
Fibonacci can provide useful standardized reference points, but it should not be treated as a mechanical prediction tool. Its usefulness improves when the levels overlap with actual market structure and are tested against your own historical data.
How deep can a breakout retrace before it becomes invalid?
There ain’t no uniform percentage. In practice, the breakout structure and whether the price breaks beyond the original breakout zone, usually determines a realistic invalidation point. You can use your own previous MRC data to set a statistical alert threshold.
Should I enter immediately after a breakout or wait for a retracement?
Both ways can work. Immediate entry offer involvement but may involve greater structural risk. Retracement entry can increase price and reward/risk but can miss breakouts that never draw back. Your journal should determine which way is best for your setup.
How can I avoid getting stopped out by normal retracements?
A meaningful sample of your trades . Watch the maximum retracement before continuation . Set stop according to structural invalidation and modify position size to maintain consistent account risk.
Final Takeaway
The error is to expect that the market will reward you with a weak pullback after a breakout.
It doesn’t.
Strong breakouts can retrace a good deal.
Weak breakouts barely retrace before failing.
But the percentage alone does not tell you which one you are looking at.
The better approach is to combine four measurements:
Breakout size.
Normal volatility.
Structural location.
Acceptance or rejection after the pullback.
Then add historical data.
When you know the typical maximum retracement of your own setups, you stop treating every pullback as a surprise.
That changes your execution.
Instead of asking, “Why is price retracing so much?”
You start asking, “Is this retracement still inside the distribution of successful breakouts?”
That is a much better question.
For your next 30 breakout trades, record one statistic you are not recording now: maximum retracement before continuation.
Do not just record whether the trade won.
Measure how far the price went against the breakout before it worked.
After enough trades, build the median, 75th percentile, and 90th percentile.
That data may tell you more about where to enter, where to place your stop, and how large to trade than any other dozen indicators ever will.
For the next read, continue with DayTradersDiary.com’s article on breakout exhaustion or its guide to fake breakouts with a volume filter. Both help answer the question that naturally follows this article: when does a normal retracement stop being a pullback and start becoming evidence that the breakout itself was wrong?