
You find a stock breaking out above resistance. Volume is coming in, candles are closing toward their highs, and the move appears strong enough to warrant a long entry. You buy on the breakout, anticipating it to continue. The Price stops, the following candle turns around, and your position begins to lose in seconds.
What happened?
One possibility is that buying pressure was weaker than it appeared. Another is that aggressive buyers were meeting substantial selling interest, or that the breakout had already consumed the available demand. The chart showed you where the Price was moving, but it did not reveal the full story behind the move.
This is the problem traders face when they try to judge order book imbalance without Level 2 data.
Order book imbalance is often treated as a direct measure of buying and selling pressure. In reality, it is more complicated. Even a full order book provides only a temporary picture of resting liquidity, not a guarantee of what will happen next. Without Level 2, you have to work with indirect evidence from price behavior, volume, candle structure, and the market’s response to trading activity.
But that does not mean you are trading unquestioningly. That implies you have to discriminate between what you can see, what you can reasonably deduce, and what is unknown.
This guide develops a viable framework for reading order book imbalance proxies without a depth-of-market feed. It talks about how to recognise possible buying and selling pressure, identify absorption-like activity, assess breakouts, and avoid mistaking a big candle for real directional control.
The goal is not to recreate a Level 2 screen from a regular chart. It is to make better execution decisions using the information you actually have.
What Is Order Book Imbalance?
Order book imbalance describes the difference between the quantity of buy and sell limit orders resting in an order book.
In a normal limit order book, buyers submit bids and sellers submit asks. The best bid is the highest buying price shown, and the best ask is the lowest selling price shown. The spread is what separates them. A simple order book imbalance formula is:
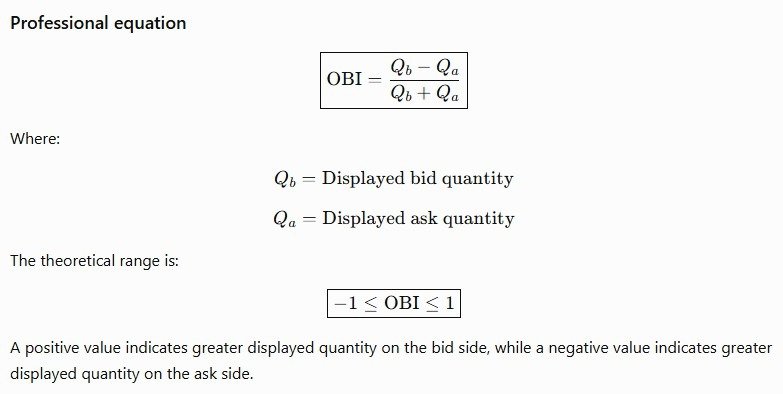
Here, (Q_b) represents the quantity of buy orders at the selected bid levels, and (Q_a) represents the quantity of sell orders at the selected ask levels.
The result ranges from -1 to +1. A positive value indicates that the displayed buy-side quantity exceeds the displayed sell-side quantity. A negative value indicates that the displayed sell-side quantity exceeds the buy-side quantity. A value near zero indicates that the displayed quantities are relatively balanced.
For example, if you are measuring across the levels, then a stock has 8,000 shares on the bid and 4,000 shares on the ask.
The imbalance is:
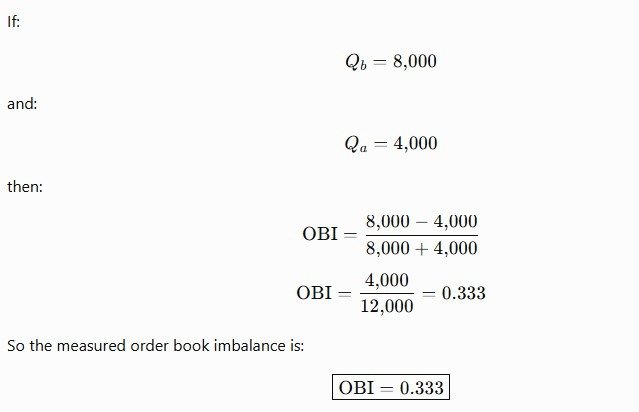
That is a positive imbalance of 0.33, meaning that there is more displayed buy-side liquidity than displayed sell-side liquidity.
But this does not automatically mean the stock will rise.
Orders can be cancelled, new orders can enter, and aggressive market orders can consume the displayed liquidity. A large bid can disappear before it is tested. Buyers can absorb a large ask. The imbalance is a snapshot of displayed interest, not a promise of future price direction.
This distinction becomes especially important when you do not have Level 2.
Can You Measure Order Book Imbalance Without Level 2?
You cannot calculate the true displayed order book imbalance without access to the relevant order book quantities.
However, you can build an order book imbalance proxy using information that is available on a regular chart.
A proxy is not a replacement for the actual order book. It is an estimate of buying and selling pressure based on observable market behavior.
The most useful proxies combine three things: the amount of trading activity, the direction of price movement, and the market’s response to that activity.
Imagine two stocks that each trade 100,000 shares during a five-minute candle.
The first stock advances steadily and closes near the candle’s high. The second stock moves sharply higher early in the candle but gives back most of the gain before closing near its open.
Both traded the same volume. Yet the price response was very different.
The first suggests that buying activity was accompanied by sustained upward progress. The second suggests that the initial buying pressure did not translate into a lasting advance.
Neither candle proves that buyers outnumbered sellers in the order book. Every executed trade has both a buyer and a seller. What differs is the aggressiveness of participants, the liquidity available at each Price, and the amount of price movement produced by the activity.
That is the distinction a useful order book imbalance indicator should try to capture.
What Research Says About Order Flow and Price Movement
Research into market microstructure provides a useful foundation for interpreting these proxies. It also explains why simple volume comparisons often fail.
In The Price Impact of Order Book Events, Rama Cont, Arseniy Kukanov, and Sasha Stoikov studied order book events across 50 U.S. stocks. Their research found a relationship between short-term price changes and order-flow imbalance, with the price impact increasing as market depth decreased.
This has the practical effect for day traders that the same volume of buying or selling activity could result in different price movements depending on the quantity of liquidity available. A tiny burst of enthusiastic buying can drastically impact the market in a thin market. In a deeper market, considerably more activity might occur with minimal influence.
This is one reason why volume alone is an incomplete measure of pressure.
In Queue Imbalance as a One-Tick-Ahead Price Predictor in a Limit Order Book, Martin Gould and Julius Bonart examined whether the relative size of bid and ask queues could help predict the direction of the next mid-price movement. Their study found predictive relationships among the Nasdaq stocks they analysed, with the strength of these relationships varying across stocks.
The practical lesson is not that a large bid guarantees an upward move. It is that the distribution of liquidity can contain information about very short-term price behavior. Without access to that distribution, a chart-based trader has to rely on less direct evidence and should avoid claiming the same predictive precision.
A third study, Deep Order Flow Imbalance: Extracting Alpha at Multiple Horizons from the Limit Order Book, by Petter Kolm, Jeremy Turiel, and Nicholas Westray, explored forecasting high-frequency returns using detailed order book information from Nasdaq stocks. The researchers found that models based on order flow could outperform models using raw order book states in their experimental setting.
This is important for the active trader, as it illustrates the difference between variations in buying and selling activity and a static image of resting orders. One candle with a big volume surge tells you little about how that activity originated. A series of price reactions can give more useful context.
These studies do not validate any particular candle-based order book imbalance proxy. They explain why observing the relationship between trading activity and price movement is a sensible starting point.
The Four-Part Framework for Judging Imbalance Without Level 2
A practical order book imbalance strategy should not begin with the question, “Are buyers stronger than sellers?”
Start with a more useful question: “What is price doing in response to the activity taking place at this location?”
The framework below has four stages: location, activity, response, and confirmation.
Each phase addresses a distinct question. Location tells you where the market is being tested. Activity shows if participation is changing. Response shows you whether that activity is making substantial progress. Confirmation tells you if the resultant price action is supportive of a trade.
That volume surge in the middle of a trading range is not the same as a volume spike at a major resistance level.
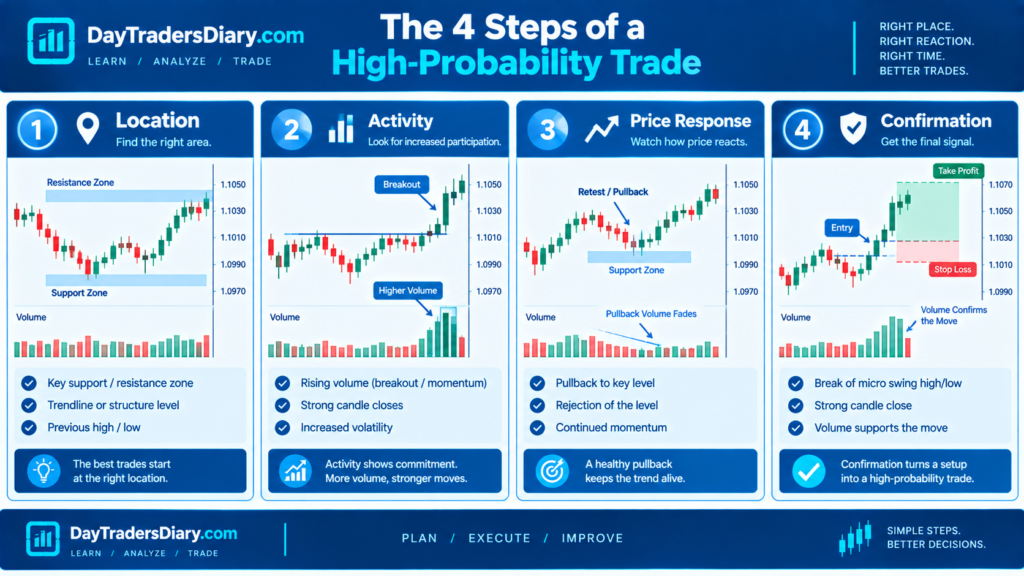
Stage One: Location Matters More Than the Candle
A volume spike in the middle of a trading range is not the same as a volume spike at a major resistance level.
If Price is in the middle of a range, it can go either way without taking control. Observing the same activity around a previous session high, a breakout level, or a well-defined support zone might illustrate how participants respond to an important price boundary.
This is why a proxy for order book imbalance should begin with market structure.
Suppose a stock has repeatedly failed to trade above $50.00. Each approach has attracted selling, and Price has returned toward $49.50.
On the next approach, volume increases, and Price briefly trades above $50.00. That alone does not tell you whether buyers are taking control.
What matters is whether Price can hold above the level, whether pullbacks remain shallow, and whether the market can continue advancing after the initial burst of activity.
If Price keeps breaking above $50.00 but closes back below it, then the breakout is fighting to gain acceptance. If Price is held above the level and subsequent pullbacks can’t get back into the prior range, that’s further evidence for continuance.
The location gives the activity meaning.
A useful way to apply this is to mark the previous session’s high and low, the current session’s developing range, obvious swing points, and levels where Price has repeatedly stalled. Then observe how Price behaves when it reaches those areas.
This also connects naturally with a broader approach to avoiding head-fake breakouts, where the key question is whether Price can sustain movement beyond a boundary rather than merely cross it.
Stage Two: Measure Activity Relative to Its Normal Baseline
A volume spike is meaningful only when you understand what is normal for that instrument and time of day.
A stock that regularly trades heavily at the opening bell may show high volume without any unusual directional pressure. A quieter period may produce a meaningful change in participation, with a much smaller absolute volume.
Instead of comparing every candle to the same fixed threshold, compare current activity to a recent baseline under similar conditions.
For example, a five-minute candle trading 250,000 shares may be ordinary for a highly liquid stock at the open but unusual during a quiet midday session.
Relative volume can help identify when participation is elevated.
A simple relative volume calculation is:
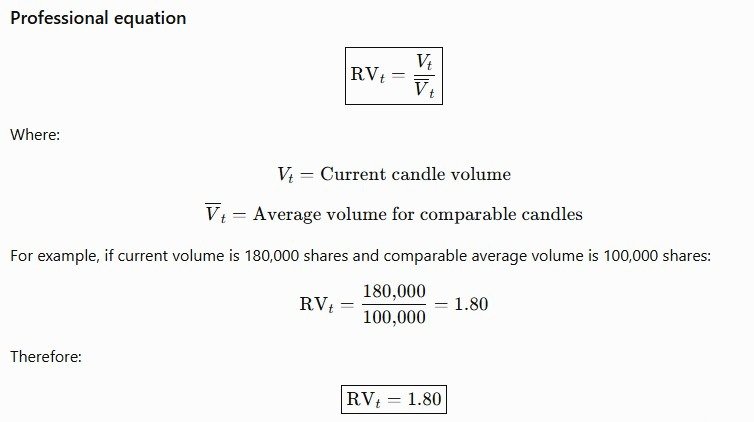
If the current candle trades 180,000 shares and the average volume for comparable candles is 90,000 shares, the relative volume is 2.0.
That means activity is twice the selected baseline. It does not mean buying pressure is twice as strong.
The direction of the activity still needs to be inferred from price behavior.
When volume increases while Price advances steadily, the market is producing upward progress during elevated activity. When volume increases, but Price barely moves, the market is showing a different relationship between activity and Price.
That difference becomes especially useful near support, resistance, and breakout levels.
Stage Three: Read the Price Response
This is the most important stage of the framework.
A chart does not show every market order, limit order, or cancellation. It shows the price movement resulting from their interaction.
The central question is whether the market is making meaningful progress relative to the observed activity.
Strong progress with elevated activity
Let’s say a stock is approaching a resistance level at $75.00. The five-minute candle closes at its high of $75.30, with much higher volume than the previous average.
The next candle opens above the breakout level, dips toward $75.10, and then moves higher.
This sequence suggests that buying activity is being accompanied by upward progress and that the former resistance area may be acting as support.
It does not prove that the order book is bid-heavy. It provides evidence that buyers are maintaining control over immediate price movements.
The practical decision is to evaluate whether a pullback offers an entry with a logical stop and enough room to the next resistance area.
High activity with little progress
Now imagine that the same stock trades 300,000 shares while repeatedly testing $75.00, but each attempt to move higher is rejected.
The candles have noticeable upper wicks, and the market struggles to hold above resistance.
This could indicate selling pressure or absorption-like activity. Aggressive buyers may be coming in, but they are not giving us consistent upward movement.
But the interpretation is not automatic. The market may be waiting for a breakout, or the candle above is a combination of several conflicting moves.
The important thing is what occurs next.
If Price can get above $75.00 and stay there, it could mean that the earlier hesitancy was just a momentary pause. If Price dips below the latest higher low and doesn’t recover the breakout level, the evidence switches toward a failed effort.
Low activity with sharp movement
A third situation occurs when Price moves quickly on relatively low volume.
This can happen when liquidity is thin and relatively little trading activity is needed to move the Price through nearby levels.
The resulting candle may look impressive, but the move may be vulnerable to a quick reversal if participation does not increase.
A sharp advance on low volume is not automatically bearish. It simply requires more caution when evaluating continuation.
The trader should ask whether the market can maintain its gains once activity returns to normal.
Stage Four: Demand Structural Confirmation
The final stage is to check whether the market’s structure supports the interpretation formed from activity and price response.
A bullish imbalance proxy becomes more useful when Price establishes a higher high, holds a higher low, or breaks a meaningful resistance level and remains above it.
A bearish proxy becomes more useful when Price fails to hold a breakout, forms a lower high, or breaks a meaningful support level and struggles to reclaim it.
This does not mean waiting for every possible confirmation. Excessive confirmation can push an entry so far from the original level that the reward-to-risk profile becomes unattractive.
The point is to avoid treating a single candle as proof of a directional imbalance.
For a breakout trader, the sequence could be a close just above resistance, a controlled retest, then a continuation effort. For a pullback trader, the sequence can be a big move in one direction, then a small pullback, then a resumption of the original move.
The appropriate confirmation depends on the setup. What matters is that the entry follows observable behavior rather than an assumption about hidden orders.
Five Practical Order Book Imbalance Proxies You Can Use on a Regular Chart
There is no single universal order book imbalance indicator for traders without Level 2. Different proxies measure different aspects of price behavior.
The most useful approach is to understand what each proxy can and cannot tell you.
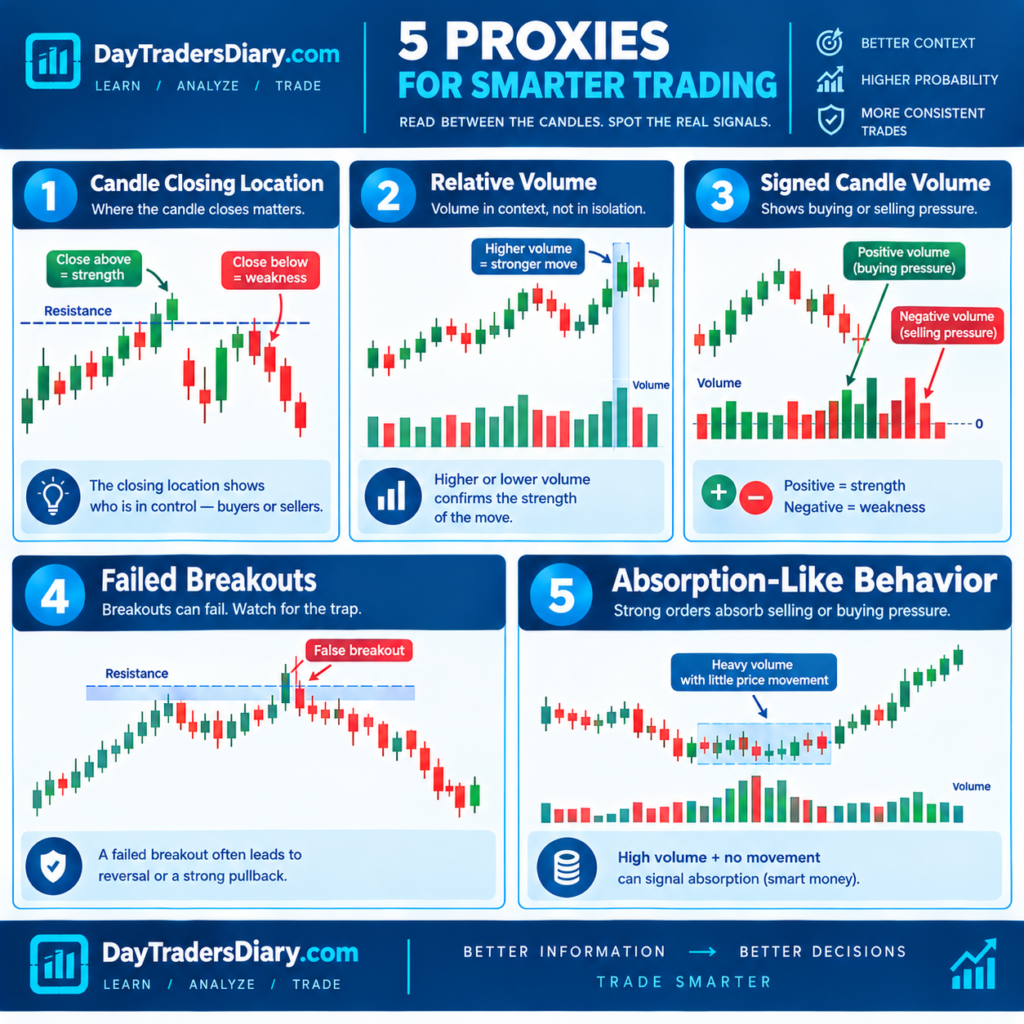
Candle closing location
A candle’s closing location provides a simple way to measure where the Price finished relative to its high and low.
One common calculation is the close location value:
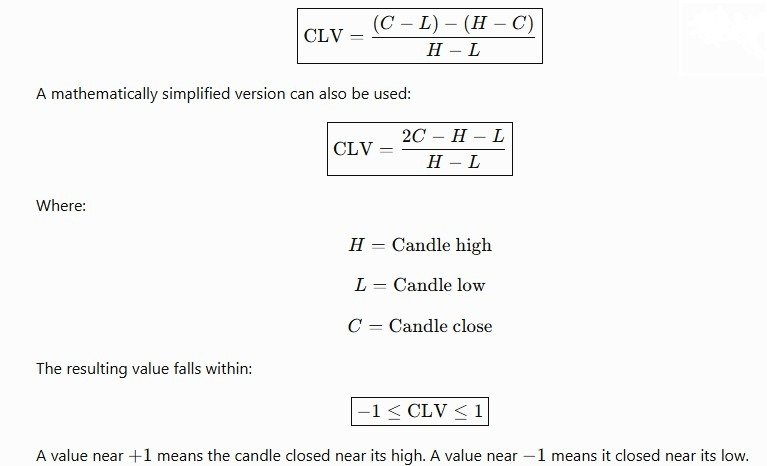
Example
Suppose:
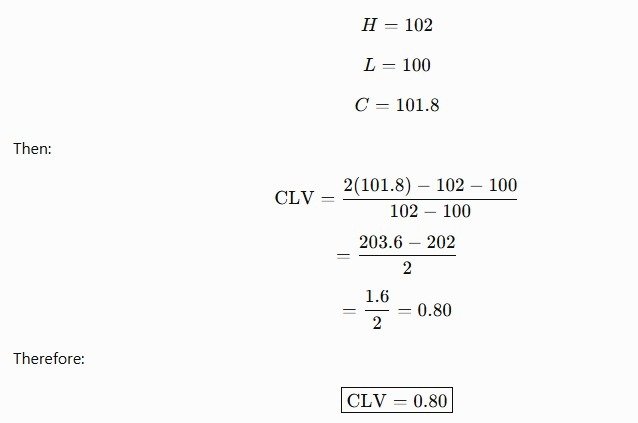
The candle closed near its high, suggesting that the market maintained much of its upward progress during that period.
But CLV is not a direct measure of buyer dominance. It does not reveal how much volume traded at the bid or ask, nor does it show whether a large resting order was cancelled.
Use it as a measure of price response, especially when comparing candles at similar market locations.
Relative volume combined with price progress
Relative volume becomes more useful when paired with the distance the Price has travelled.
Imagine two bullish candles with similar ranges. The first trades 50,000 shares, while the second trades 200,000 shares.
The second candle generated four times as much volume, but if both produced roughly the same price movement, the relationship between activity and progress is different.
You can compare volume with the distance travelled in ticks, points, or a volatility-adjusted measure.
A simple conceptual measure is:
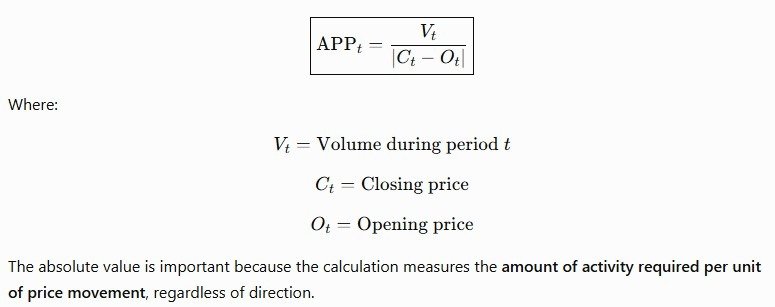
For Example:
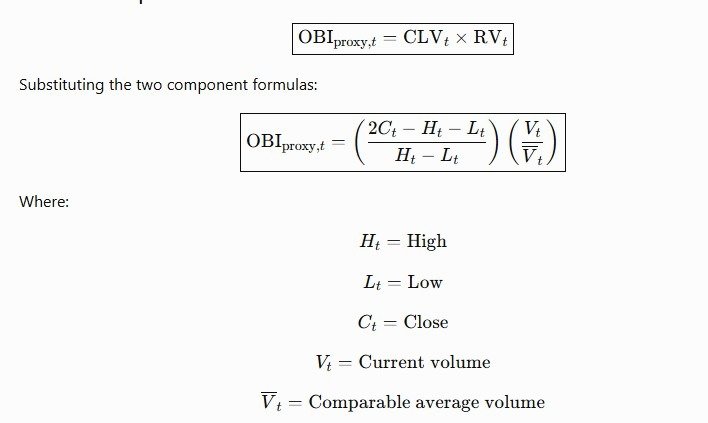
A high value means substantial volume was associated with relatively little net price movement. A low value indicates lower volume and a larger net move.
This is not an exact metric. A candle might travel a long way and come back close to where it started; therefore, the net change in Price is a misleading measure. It also has to be scaled to the instrument’s normal activity and pricing scales.
For that reason, compare similar candle intervals and use the measure alongside the full candle range and closing location.
Signed candle volume
Some traders assign a positive sign to volume on bullish candles and a negative sign to volume on bearish candles.
A simple version is:
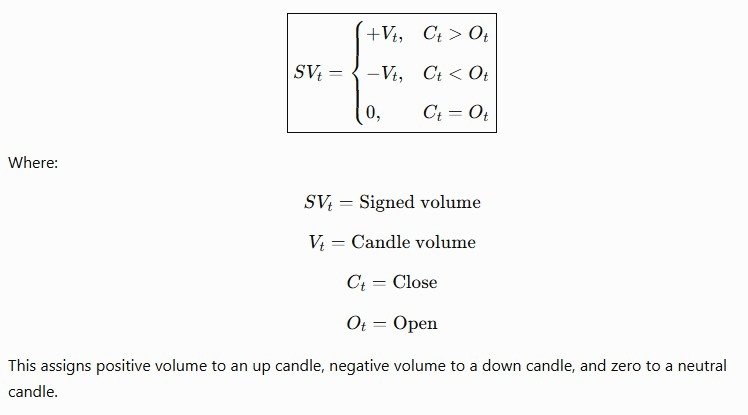
Here, (V) is candle volume, (C) is the close, and (O) is the open.
This can be useful for building a rough directional activity series. It is not true to buy volume minus sell volume.
A bullish candle can contain substantial selling activity, and a bearish candle can contain substantial buying activity. The candle’s final direction does not reveal the aggressor side of every trade.
If you are using signed candle volume, treat it as a rough proxy for price direction and see whether it adds anything to the Price.
Failed breakout behavior
A failed breakout can reveal a mismatch between the market’s attempted direction and its ability to sustain progress.
Suppose price breaks above a prior high, trades higher for several minutes, and then falls back below the breakout level.
If the next recovery attempt fails near the same area, the market is showing difficulty sustaining the move.
That behavior may reflect aggressive buying meeting available supply, a lack of follow-through, or a change in broader market conditions.
The failure itself is observable. The exact order book mechanism behind it is not.
This is why failed breakout behavior can be more useful as a trade filter than as a standalone imbalance signal.
Instead of selling simply because a breakout failed, wait for a structural change that provides a clear invalidation point. A lower high or a break of the pullback low may offer that structure.
Repeated rejection and absorption-like behavior
Absorption is often described as a situation in which aggressive orders are met by resting liquidity, limiting price progress.
Without Level 2 or trade-level data, you cannot confirm the actual resting liquidity responsible for the behavior.
You can, however, identify an absorption-like pattern.
For example, Price repeatedly tests $40.00; volume increases on each attempt, but the market cannot sustain trading above that level. After several attempts, Price begins making lower highs.
The observable evidence is frequent activity near resistance without any real upward movement, followed by a weakening price structure.
This could indicate selling interest and cap the advance. It may also signify that purchasers are losing urgency or that there is broader market pressure.
The distinction matters because the pattern is evidence of a struggle at a price level, not proof of a particular participant’s intentions.
A Worked Example: Reading a Bullish Imbalance Proxy
Let’s imagine a stock is trading at $48.00. The high from the previous session is $48.50, and the stock has attempted to take out that level twice in the current session and has failed.
The third attempt begins with a strong five-minute candle. Volume is twice the recent comparable-candle average, and the candle closes at $48.58.
At this point, the evidence is mixed but constructive. Price has moved through resistance on elevated activity and closed above the level. However, a single close does not establish that the breakout will hold.
The next candle pulls back to $48.51, briefly trades below the breakout level, and then closes at $48.66.
This is more informative. The market tested the former resistance area and recovered, suggesting the breakout is attracting sufficient demand to sustain upward momentum.
A trader looking to go long could target a continuation above the pullback high or a controlled retest of the breakout level.
The stop should be put at a price which invalidates the specific setup, not at a random distance to accommodate a preferred position size.
Now consider the alternative.
The breakout candle closes at $48.58, but the next candle falls to $48.35 and closes near its low. A recovery attempt fails at $48.50, and Price then breaks the latest pullback low.
The same initial volume spike now sits inside a failed breakout sequence.
The important lesson is that the first candle did not change its historical meaning. What changed was the market’s response after the breakout.
A proxy can be useful if it is updated as new information comes in and not viewed as a fixed directional signal.
A Worked Example: Reading a Bearish Imbalance Proxy
Imagine a stock trading near $120.00, with support established around $119.40.
Price breaks below support during a five-minute candle with elevated volume. The candle closes at $119.25, below the prior range.
A bearish interpretation is possible, but the next test matters.
The following candle rebounds to $119.42 and then closes at $119.18. Price has attempted to reclaim the broken support level but failed to hold above it.
A subsequent move below $119.10 would provide additional evidence that the breakdown is continuing.
For a short trade, the relevant question is whether the entry offers enough room to the next support area and whether the stop can be placed beyond a meaningful invalidation point.
Now imagine that Price instead reclaims $119.40 immediately and moves back into the prior range.
The original breakdown has failed to establish acceptance below the support level. A trader who interpreted the initial volume spike as definitive selling pressure may now be trapped in a short position.
The lesson is straightforward: elevated activity near a level is a reason to pay attention, not a reason to assume the outcome.
How to Build an Order Book Imbalance Indicator Without Level 2
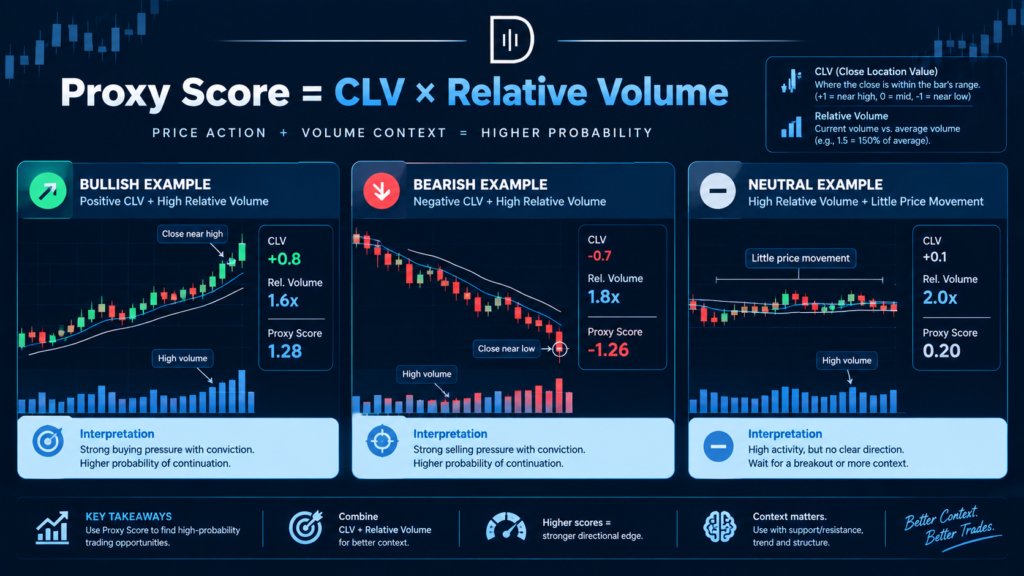
A simple chart based indication can be based on relative volume , closing of the candle and direction of price movement.
One possible experimental Score is:
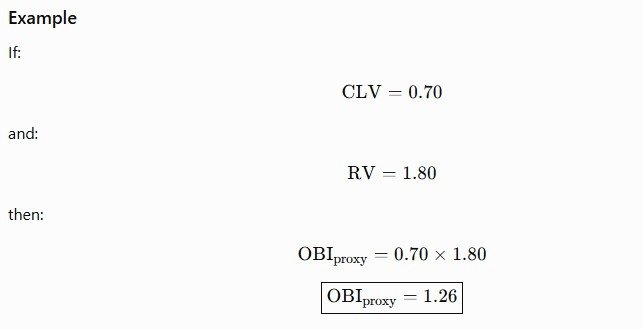
A positive result means the candle closed near the high, indicating activity is elevated relative to the baseline you set.
A negative value indicates the opposite relationship.
This Score is not a true measure of order book imbalance. It is a directional activity proxy. It should not be interpreted as a probability of a price increase or decrease.
It has a downside, however: multiplying by relative volume might cause very active candles to dominate the Score. You do not just assume greater numbers are better. It must be tested by the trader who utilises it to see if the increased weighting leads to better decisions.
A more practical version can separate the information into two readings. The first measures the direction and location of the closure. The second measures relative activity.
This separation makes it easier to recognise different conditions.
High volume and a strong positive closing location indicate the move higher occurred during vigorous trading. A strong positive close on modest volume shows that Price moved up with no unusual participation. A higher volume with a close near neutral means there was a lot of activity relative to the progress made.
Those are different market conditions, and they should not be compressed into a single bullish or bearish label without further context.
When an Order Book Imbalance Proxy Fails
The most dangerous mistake is assuming that a proxy reveals the hidden order book.
A candle chart does not show the full distribution of resting liquidity. It does not show every order cancellation, hidden order, or aggressive trade. A chart-based estimate cannot reliably distinguish between a large seller absorbing buying pressure and a market lacking sufficient buying interest to continue.
The limitations become particularly important in decentralised markets such as spot forex.
Spot forex does not trade on a single centralised exchange order book. Liquidity is distributed across banks, dealers, electronic communication networks, and other venues. A broker’s tick volume or price feed reflects activity available through that provider, not the entire global market.
Consequently, a forex trader using a candle-based order book imbalance indicator should treat the result as a proxy for price action and activity rather than a measure of global bid and ask liquidity.
Futures and exchange-traded equities have more centralised market data, but even there, the book shown is partial and can change quickly. The quality of the proxy depends on the instrument, data source, time frame, and market conditions.
A typical mistake happens when there are substantial economic discharges. Prices can swing sharply since liquidity might be withdrawn, spreads can expand, or new information can change participants’ willingness to trade. The increase in volume on a news event may not behave like an increase in a normal session.
Here is where the trader’s understanding of the risk of news-driven entry delays comes into play. What looks appealing on a candle near may not have the same execution quality a few seconds later.
Turning the Framework Into a Day Trading Strategy
A useful order book imbalance strategy should define the conditions under which a proxy is allowed to influence a trade.
Start with a setup that already has a clear structural reason for entry. This could be a breakout, a pullback in an established trend, or a reversal attempt at a meaningful level.
Then use the imbalance proxy to evaluate the quality of the price response.
For a bullish breakout, the relevant evidence may include elevated relative volume, a close above resistance, and a successful retest. A bearish breakdown may include elevated activity, a close below support, and a failed recovery attempt.
The proxy should refine the setup rather than replace it.
This approach prevents a common form of overtrading: entering every time a candle closes near its high or every time volume increases.
A trader can also distinguish between an entry signal and a trade filter.
An entry signal tells you when a specific setup has reached its trigger condition. A filter helps you decide whether to take the trade at all.
For example, a failed breakout might be the entry signal, while the volume and price-response pattern helps filter out weak failures that occur in the middle of a range.
That separation makes the strategy easier to test and review.
Risk Management: The Proxy Does Not Set Your Stop
A trade can be evaluated with the help of an imbalance proxy but should not be the deciding factor for your risk budget.
Your stop should reflect the price level at which the trade thesis is no longer valid. Your position size should then be calculated from the distance between entry and stop, together with the amount of capital you are willing to risk.
For example, if you go long at $50.20 with a stop at $49.90. Risk per share: $0.30
The position size based on a $60 risk per trade is:
[Position Size = 60 / 0.30 = 200 shares]
This is a reduced calculation, without commissions, slippage and other execution charges. These expenses can be significant, especially for sparsely traded or fast-moving securities.
This is where a Position Size Calculator helps remove guesswork from the sizing process. It allows you to work backwards from your risk limit rather than choosing a position size first and hoping the stop distance fits.
There is another important point: a proxy can become weaker after entry.
Suppose you enter a breakout after a successful retest. Price then returns below the breakout level and fails to recover. That may invalidate the setup even if the original volume reading remains high.
Do not keep a trade open simply because the initial indicator reading looked strong.
Your trade thesis should be updated using current price behavior. If the market no longer behaves as expected, the original evidence may no longer justify remaining in the position.
Execution Discipline: Why the Best-Looking Signal Can Still Be a Bad Trade
A trader can be right but still lose money because he is late to the party, his stop is in a bad spot, or his reward is too small.
Suppose a stock breaks above resistance at $25.00 and reaches $25.80 before you notice the move. The chart still looks bullish, and the volume remains elevated.
But if the next meaningful resistance area is $26.00, entering at $25.80 may leave too little room for a favourable trade.
The direction may be right while the execution is poor.
This is why imbalance analysis should be combined with a clear assessment of the entry price, invalidation level, and remaining distance to the next meaningful obstacle.
A useful execution question is: “If I enter here, what price movement must occur for this trade to offer an acceptable reward relative to the risk?”
If the answer requires an unusually large continuation move, the setup may no longer be attractive.
Waiting for a pullback can improve the entry location, but it introduces a different risk: the market may never retrace. Missing a trade is not the same as making a mistake.
A disciplined trader does not need to participate in every move that appears to have directional pressure.
Journaling and Performance Optimisation
The real value of an order book imbalance proxy becomes clearer when you record how it performs across a meaningful sample of trades.
A trader who remembers only the successful breakouts may conclude that high relative volume and strong candle closes are reliable signals. A trader who records failed breakouts, false starts, and late entries may discover that the same proxy works only under specific conditions.
Your diary should contain the circumstances in which the signal appeared, not just if the deal was lucrative or not.
Look at the instrument, session, setup type, key price level, relative volume, candle close, and market reaction after the signal. Indicate if the entry was immediately after a breakout, on a retest, or after a delayed continuation.
Also record the trade’s planned risk, actual execution price, stop distance, slippage where available, and final result in R multiples.
A particularly useful distinction is whether the proxy improved the trade decision or agreed with a setup you would have taken anyway.
For example, look at similar breakouts with high relative volume and no relative volume. If the high-volume group has better follow-through but also larger unpleasant excursions, the information can be valuable as a filter, but it is not required to broaden the stop.
The goal is to identify where the proxy changes the quality of your decisions.
Use a Trade Journal Template to organise these observations and review them consistently. Over time, you can separate the results by instrument, session, volatility regime, and setup type.
That analysis may reveal that the proxy is useful during the opening session but unreliable during midday consolidation. It may work better for continuation trades than for reversals. It may add little value when the market is already trending strongly.
These are the kinds of findings that can turn a vague trading idea into a defined process.
How to Test an Order Book Imbalance Proxy Before Using It Live
A proxy should earn its place in your trading process through testing.
Start with one setup, one instrument and one well-defined signal. Don’t combine numerous indications and change many rules simultaneously. Otherwise, it is difficult to know what actually caused the improvement.
For example, you might test whether elevated relative volume, combined with a strong candle close, improves the follow-through rate of breakouts above the previous session’s high.
Define the conditions before reviewing the results. Decide what counts as elevated volume, how the breakout is identified, what constitutes confirmation, and how the trade is managed.
Then compare the outcomes of qualifying setups with a reasonable baseline.
Do not rely only on the win rate. A filter can increase the win rate while reducing the number of trades or the average size of winners. Another filter may lower the win rate but improve average reward relative to risk.
Evaluate expectancy, average R per trade, maximum adverse excursion, maximum favourable excursion, and the frequency of false breakouts.
A proxy that looks useful over ten trades may be nothing more than a small-sample effect. A larger sample across different market conditions provides a more informative picture, although it still cannot guarantee future performance.
Once you create the rules, backtest them on historical data, then in a paper-trading or low-risk scenario. Don’t modify the first rules for a while, so you can observe how they function, then change them.
The goal of testing is not to discover the optimal signal. The question is whether the proxy adds quantitative value to a process that already has defined entry, exits and risk limits.
Scaling and Capital Growth: From a Trading Edge to a Repeatable Process
A trading edge is useful only when it can be executed consistently within the limits of your available capital and risk tolerance.
A trader may develop a process that produces positive expectancy over a sufficiently large sample but still face practical constraints. Account size, drawdown limits, execution costs, and the ability to maintain discipline during losing periods all influence how that process can be applied.
This is one reason some traders explore evaluation-based proprietary trading programs.
An evaluation account is not a shortcut to capital, and passing an evaluation does not establish that a strategy has a durable edge. These programs typically impose rules and conditions that traders must understand before participating. Fees, drawdown calculations, profit targets, payout conditions, and permitted trading practices can vary significantly.
For traders who already have a tested process, an evaluation may provide a structured way to assess whether they can adhere to defined risk limits while trading under the program’s conditions.
The5ers is one provider traders may consider when researching evaluation-based funding pathways. FTMO and FundingPips are other names in the broader prop trading market. Their programs, eligibility requirements, fees, and rules can change, so traders should review the current terms directly before making a decision.
If you are considering a The5ers evaluation account, be sure that its current rules match your real trading style. For example, an approach that relies on holding through specific market events may not work for a program that limits certain trades.
The same principle applies to any evaluation provider. The goal is to find a structure that accommodates a proven process, not to modify a fragile strategy to pass an evaluation.
For traders using order book imbalance proxies, this distinction is especially important. A proxy that produces inconsistent results or requires frequent discretionary overrides may become harder to execute under strict drawdown conditions.
Build the process first. Evaluate capital options only after you understand how the strategy behaves across different market conditions.
A Practical Daily Routine for Reading Imbalance Without Level 2
Before the session starts, identify the important price points that are likely to affect trading during the session. Search for past session highs and lows, the current pre-market range (if applicable), and any obvious places of established support or resistance.
Once the market opens, watch for Price action at certain levels. Watch for a rise in relative activity, watch for Price to make some real progress and watch to see whether the move sticks after the initial push.
When a possible setup comes up, take the facts and break them down into 3 questions.
First, is the Price at a place where the setup makes sense?
The second is whether the activity is progressing in the right direction or the market is failing to move despite high involvement.
Third, has the market confirmed the behavior through a hold, retest, or structural change that fits the setup?
If the answers are unclear, there is no need to force a trade.
After the trade, record whether the proxy helped you enter, avoid a poor setup, or recognise a change in market behavior. Review the decision separately from the outcome.
A profitable trade can still be poorly executed, and a losing trade can still follow a sound process.
That distinction is essential when evaluating whether an order book imbalance proxy is genuinely improving your trading.
Frequently Asked Questions
Can you see the order book imbalance without Level 2?
Not to me. If you want to have a real order book imbalance you need bid/ask amounts. If you don’t have Level 2 or similar market-depth data, you can only infer pressure from indirect evidence such as price action, candle structure, relative volume, and how the market reacts to activity.
What is the best order book imbalance indicator without Level 2?
There is no one best indicator. A suitable framework may be the candle close and price reaction around substantial support or resistance combined with relative volume. Its value is instrument, time period and trade configuration dependent and should be reviewed before using it to make real judgments.
What is the order book imbalance formula?
A popular formula is ((Q_b-Q_a)/(Q_b+Q_a)) where (Q_b) is the shown bid amount and (Q_a) is the displayed ask quantity across the selected book levels. The outcome is in the range of -1 to +1. This formula requires actual order book quantities and cannot be estimated exactly from normal candle data alone.
Does high volume mean buyers are stronger than sellers?
No. Each trade is between a buyer and a seller. High volume means lots of trade activity, but not necessarily a dominant direction. See if the action creates continued upward or downward momentum, and if Price respects the resulting move, to know how Price reacts.
How can you identify buying pressure without Level 2?
Look for a combination of strong upside momentum, significant activity relative to a relevant baseline, high quality closing positions, and good retests of key levels. These observations could imply that buying interest is sustaining higher prices, but they are not a reflection of the whole order book or a guarantee of continuing price support.
Can order book imbalance proxies work in forex?
They can provide indirect hints about price action, but there is no centralised order book in spot FX. Market activity is not limited to broker tick volume and price data. Think of chart-based data as proxies rather than full estimates of worldwide buying and selling pressure.
What is the difference between order book imbalance and order flow imbalance?
The order book imbalance is typically the relative quantity of resting buy and sell limit orders. The order flow imbalance reflects variations in supply and demand driven by market orders and by the addition and cancellation of limit orders. Both notions are related to liquidity and price formation, but measure different aspects of market activity.
How do you use an order book imbalance strategy for breakouts?
Start with a well-defined breakout level. Look for a spike in activity as Price passes the level, the market to close through it, and for a retest to hold. If Price pushes back into the prior range and fails to rebound, the breakout may be losing support. Apply a certain level of invalidation and don’t accept a single-volume surge as evidence of continuation.
Can an order book imbalance proxy predict the next candle?
It can assist in setting up conditions related to short-term price action, but it cannot, on its own consistently anticipate the next candle. Market conditions are dynamic, and the same proxy can produce various results based on liquidity, volatility, and price levels.
How should traders evaluate an order book imbalance indicator?
Test it on a clean trading setup. Compare qualifying signals to a baseline. Review expectancy, average R, unfavourable excursion, false-breakout frequency and execution costs. You may break down results by instrument and session to see where the proxy adds value and where it doesn’t.
Final Thoughts: Stop Guessing What the Order Book Is Doing
You don’t need a secret order book to make superior trading judgments.
What you need is a disciplined manner of interpreting the information that is genuinely there to be observed.
A strong candle doesn’t mean buyers are in control. A volume spike is not evidence of absorption. A failed breakout is not evidence that sellers were in control of the order book. Each is a piece of evidence that is more relevant when paired with location, activity, price reaction and structural confirmation.
The practical edge comes from recognising when the market is making meaningful progress, when activity is failing to produce progress, and when a trade no longer fits the evidence.
For your next 20 qualifying setups, record the relative volume, candle closing location, key price level, and what Price does immediately after the signal. Compare those observations with your normal entry process.
Do not change your entire strategy based on a handful of outcomes. Look for repeatable differences in execution quality and trade expectancy.
If you want to continue developing this approach, the next read should be How To Avoid Head-Fake Breakouts, which shifts the focus from interpreting activity to identifying when a breakout fails to establish sustained movement beyond a key level.