
One of the easiest ways to ruin a good trade is to protect it too quickly.
A trader enters EUR/USD at 1.0850 with a 20-pip initial stop. The trade moves 15 pips in profit. Feeling uncomfortable about giving the profit back, the trader moves the stop to +5 pips.
Price pulls back 8 pips.
Stopped out.
Five minutes later, the pair rallies another 60 pips.
The trader was directionally correct. The setup worked. The analysis was not the problem.
The trailing stop was.
This is where many traders misunderstand a pip-based trailing stop. They treat it as a mechanical safety mechanism rather than a separate part of the trading strategy.
A trailing stop is not automatically better because it protects more profit.
A 5-pip trail is not inherently safer than a 20-pip trail.
The correct distance depends on what you are trading, when you are trading it, how volatile the market is, how your entry behaves, and how much normal retracement your strategy needs before continuation.
The objective of this article is to build a trailing stop method from the ground up. Rather than choosing an arbitrary number such as 10, 15, or 20 pips, we will create a framework that connects pip distance, market volatility, trade structure, R multiples, and actual performance data.
The Problem With Choosing a Fixed Pip Distance
A fixed trailing stop sounds wonderfully simple.
“Once I’m 20 pips in profit, trail by 10 pips.”
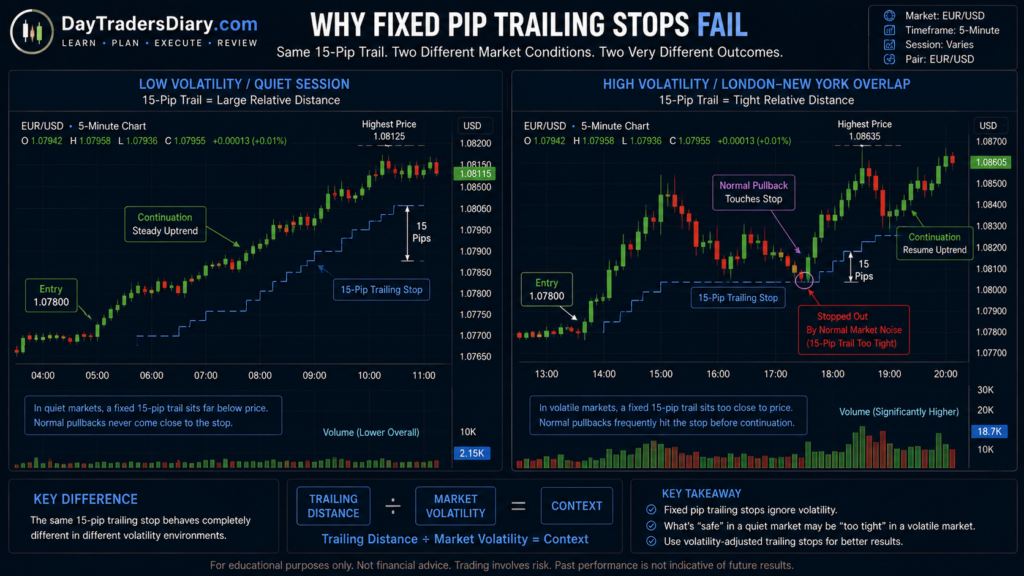
The problem is that markets do not move in fixed increments of volatility.
Consider two EUR/USD trades.
During the Asian session, EUR/USD might move relatively slowly, with five-minute candles averaging only a few pips.
During the London or New York session, the same pair can move several times that amount within minutes.
A 10-pip trailing stop has a completely different meaning in those environments.
During quiet conditions, 10 pips may represent a large amount of normal price movement.
During a volatile news-driven move, 10 pips may be nothing more than ordinary noise.
This leads to the first principle of a pip-based trailing stop strategy:
A pip distance only has meaning when you understand the volatility surrounding it.
The number itself is not the edge.
The relationship between the number and the market is.
What Research Says About Trailing Stops
There is an important distinction between using a trailing stop to reduce downside and using one to maximize returns.
Research by Dai, Marshall, Nguyen, and Visaltanachoti examined trailing stop-loss rules across U.S. equities and found that trailing stops can reduce downside risk and improve risk-adjusted outcomes. However, they can also produce lower mean returns than simply holding the position.
That trade-off is exactly what day traders experience.
A tighter trailing stop can improve the amount of profit you actually keep when the market reverses.
But the same stop can also remove you from trades that would have continued.
A similar conditional result is reached in another recent 2026 study by James Battle. If the drift is assumed constant, trailing stops can be harmful to expected returns, but they can be more advantageous when the market worsens, or when the directional drift is unknown.
That gives us a much more useful way to think about trailing stops.
The question is not:
“Does a trailing stop work?”
The better question is:
“Under which market conditions does this trailing distance improve my particular strategy?”
Research by Leung and Zhang also treats trailing stops as a path-dependent exit problem rather than simply a fixed percentage rule.
For active traders, this is an important insight. Your exit depends not only on where the price eventually goes, but on the path the price takes to get there.
What a Pip-Based Trailing Stop Actually Does
For a long trade, a pip-based trailing stop maintains a predefined distance below the highest price reached after activation.
Suppose you buy EUR/USD at 1.1000.
Your initial stop is 1.0980.
You decide to use a 15-pip trailing distance.
Once the trailing mechanism becomes active, the stop attempts to remain 15 pips below the highest price reached.
If EUR/USD rises to 1.1030, the trailing stop would sit around 1.1015.
If the price then rises to 1.1040, the stop moves to approximately 1.1025.
If the price falls to 1.1025, the trade exits.
For a short position, the logic is reversed.
The important word is activation.
A trailing stop does not necessarily need to be active immediately after entry.
In fact, for many day trading strategies, activating it too early is one of the biggest problems.
The Two Decisions Traders Often Confuse
There are actually two separate questions.
When should the trailing stop begin?
And:
How far behind the price should it trail?
Most traders focus entirely on the second question.
That is a mistake.
Suppose you enter a breakout trade.
Your initial risk is 20 pips.
If you activate a 10-pip trailing stop after only 5 pips of profit, you have effectively converted your trade into a very short-term mean-reversion position.
Your original strategy may have expected a 30 to 50 pip continuation.
The trailing stop has changed the trade before the market had enough room to prove the thesis.
So build the method in two stages.
First, define activation.
Then define distance.
Start With Initial Risk
Your initial risk is typically the clearest reference point for a trailing stop.
Suppose
Entry = 1.0850
First stop = 1.0830
Starting risk = 20 pips
Now, define trailing activation in R.
You could test activation at:
0.75R
1R
1.25R
1.5R
2R
This is much more useful than saying:
“Start trailing after 15 pips.”
Why?
Because 15 pips represents 0.75R on this trade.
But if another setup has a 40-pip initial stop, 15 pips represents only 0.375R.
The same trailing rule would behave very differently.
A Better Starting Framework
Rather than:
“Trail by 15 pips.”
Try this:
“Trigger trailing stop on price hit 1R, then trail by 0.75R.”
First risk 20 pips:
Activation = +20 pips.
Trailing distance = 15 pips.
If the initial risk is 40 pips:
Activation = +40 pips.
Trailing distance = 30 pips.
Now your method scales with the structure of the trade.
This is a major improvement.
But it still does not account for volatility.
That comes next.
Pip Distance Versus Volatility
Imagine two trades, both have an initial stop of 20 pips.
Trade A occurs during a quiet session.
ATR is relatively low.
Trade B occurs during a volatile U.S. session.
ATR is much higher.
A 15-pip trailing distance may be reasonable for Trade A.
For Trade B, it may be so tight that normal fluctuations repeatedly stop you out.
This is why I like thinking about trailing distance in two dimensions:
R-based distance
and
volatility-based distance
You can then use whichever constraint is more appropriate for the strategy.
Build a Volatility-Adjusted Pip Trail
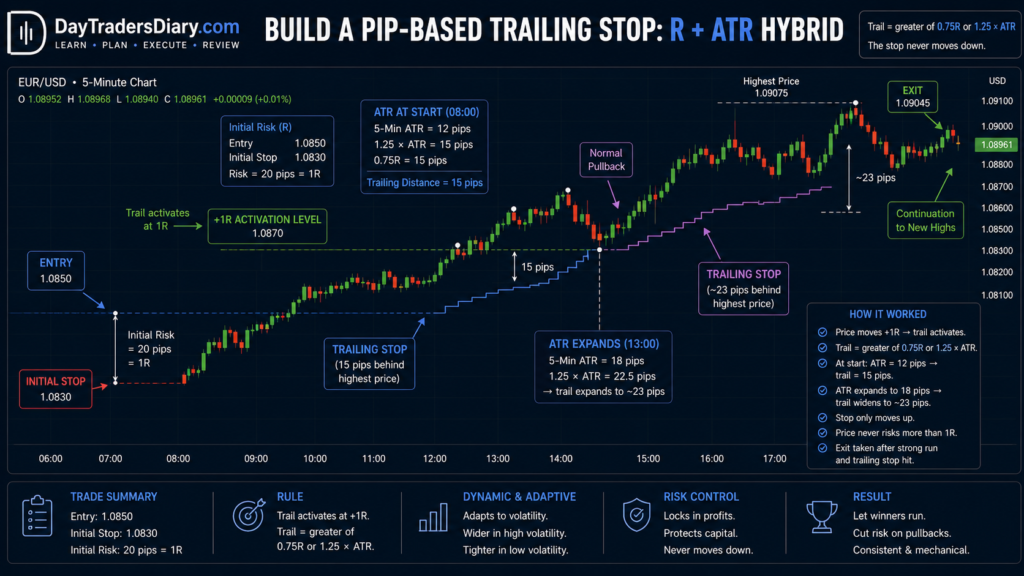
Let’s say that the 5 min ATR of EUR/USD is 12 pips.
You might try a trailing distance of 1.25 times that ATR.
which gives:
12 x 1.25 = 15 pips.
Now let’s say the 5-min ATR goes up to 20 pips.
Doing the same computation yields:
20 × 1.25 = 25 pips.
The trailing stop automatically expands as market movement expands.
This does not mean ATR is magical.
It simply provides context.
A 15-pip stop during a 20-pip ATR environment is fundamentally different from a 15-pip stop during a 7-pip ATR environment.
The Hybrid Method
A very beneficial paradigm for active day traders is to integrate R and volatility.
For instance:
Trailing distance = MAX(0.75R, 1.25 x short-term ATR)
Let’s say your first risk is 20 pips.
0.75R = 15 pips.
ATR short term = 12 pips.
1.25 x ATR = 15 pips.
Distance from trailing = 15 pips.
Now let’s say volatility rises.
ATR increases to 18 pips.
1.25 x ATR = 22.5 pips.
Now you have a trailing distance of about 23 pips.
The system allows the market more room because the market itself is moving more.
This is considerably more intelligent than keeping a fixed 15-pip trail across every condition.
But Do Not Overcomplicate It
You do not need a complicated mathematical model.
If your strategy is simple, the exit method should remain simple enough to execute consistently.
A practical starting model is:
Activation: 1R
Trailing distance: 0.75R to 1R
Volatility check: Compare trailing distance and current ATR
Try variants. And then:
In some ways you can make a 1R activation and then a 0.5R trial.
Trend following strategies 1.5R activation with 1R trail may work nicely.
There is no universal optimal number.
Your job is to discover the number that matches your setup.
The Most Important Variable: Trade Type
A trailing stop should not be identical across every strategy.
A breakout trade behaves differently from a mean-reversion trade.
A momentum trade behaves differently from a pullback trade.
A scalp behaves differently from a trend continuation trade.
Suppose your breakout strategy typically produces explosive initial movement.
A tight trailing stop might make sense because the trade is expected to move quickly.
Now consider a retracement strategy.
The trade may need several small pullbacks before continuation.
A tight trail could destroy the strategy’s expectancy.
This is why I strongly recommend tagging your journal by setup type.
Do not ask:
“What trailing stop works?”
Ask:
“What trailing stop works for this setup?”
Breakout Trailing Stops
Breakouts often have a distinctive path.
Price compresses.
Breaks resistance.
Expands.
Pulls back.
Continues.
If you trail too aggressively during the first expansion, the normal breakout retest can remove you.
A useful approach is to wait for the breakout to establish itself before activating the trail.
For example:
Breakout entry.
First stop under the structure.
Let the price be 1R.
Once 1R is reached, move the management stop to a specified level or turn on a wider trailing distance.
Then tighten only after further expansion.
This gives the breakout room to breathe.
Pullback Trailing Stops
Retracement trades often require even more patience.
Imagine EUR/USD rises 40 pips.
It pulls back 12 pips.
You enter.
Price moves 15 pips in your favor.
Then pulls back 8 pips.
A 10-pip trailing stop gets triggered.
Price rallies another 50 pips.
The trade did not fail.
Your management method failed to account for the strategy’s normal retracement behavior.
This is why your journal should record the maximum favorable excursion and maximum adverse excursion.
You need to know how much a winning trade typically pulls back before reaching its eventual target.
The MFE Test
Maximum Favorable Excursion, or MFE, tells you how far a trade moved in your favor before it closed.
Suppose 100 historical winners show that:
The average MFE before final exit is 45 pips.
The average pullback from the maximum favorable price before continuation is 12 pips.
A 5-pip trailing stop is obviously going to be problematic.
A 15-pip trailing stop may be more reasonable.
Now you are not choosing the number because it “feels right.”
You are using the behavior of your own trades.
Measure Maximum Adverse Excursion Too
MAE tells you how far trades moved against you.
This helps answer another important question:
How much room does a trade need before it proves itself?
Suppose your winning trades frequently experience 8 to 12 pips of adverse movement after entry.
If you activate a 5-pip trailing stop immediately, you are demanding that winners behave perfectly.
Markets rarely do that.
A good trailing method respects the natural path of the strategy.
The Three-Stage Trailing Stop Method
For many active day trading strategies, I prefer a three-stage approach.
Stage one is protection.
Stage two is profit capture.
Stage three is trend preservation.
Here is how it works.
You enter with a 20-pip initial stop.
The trade reaches +1R, or +20 pips.
You activate the trailing mechanism.
The initial trailing distance might be 20 pips.
Price reaches +2R.
Now you tighten the trail to 15 pips.
Price reaches +3R.
You tighten again to 10 pips.
Notice what happened.
The market receives more room when the trade is young.
As the trade becomes increasingly profitable, you gradually demand less room.
That is very different from putting a 10-pip trail on the trade from the beginning.
Why Progressive Tightening Makes Sense
Early in the trade, your thesis is still being tested.
Later in the trade, you have more evidence.
This means your tolerance for giving back open profit can decrease as the trade matures.
You are effectively saying:
“At +1R, I still want to give this trade room.”
“At +2R, I want to protect more.”
“At +3R, I am willing to sacrifice some continuation potential to preserve a larger realized gain.”
This is a psychological and statistical decision, not simply a technical one.
Do Not Move the Stop Based on Your Account Balance
This is a common mistake.
The trade reaches +$150.
You become uncomfortable.
You tighten the stop because you do not want to lose the $150.
The market does not care about your unrealized P&L.
Your stop should respond to the trade’s behavior, not the emotional significance of the dollar amount.
A 15-pip movement is still 15 pips whether it represents $15 or $1,500.
This is one reason pip-based or R-based management can be psychologically cleaner.
Pip-Based Does Not Mean Emotion-Based
There is another trap.
A trader says:
“I use a 10-pip trailing stop.”
But when the market is moving fast, they change it to 20.
When the market is slow, they reduce it to 5.
Now it is not a strategy.
It is emotional improvisation.
If you want a discretionary trailing mechanism, specify exactly when discretion is allowed.
For example:
The only way I can widen the trail is if short-term ATR rises above the predefined threshold.
That’s a rule.
“I widen it because the candle looks scary.”
That is emotion.
The News Problem
A pip-based trailing stop can behave badly around high-impact news.
Suppose you are long GBP/USD with a 15-pip trail.
CPI is released.
Price moves 40 pips in seconds.
The market then retraces 20 pips.
Your trailing stop may be triggered despite the larger trend remaining intact.
This does not necessarily mean the trailing stop is wrong.
Your strategy should not use the same management parameters under new conditions.
Separate normal-session trades from news-driven trades in your statistics.
Session-Specific Trailing Distances
You can also test different trailing distances by session.
For instance:
Asia: trading in a tighter range.
London session: moderate trail.
London-New York overlap: broader track.
The logic is not that one session is better for all.
The rationale is because the distribution of intraday volatility is changing.
If your journal confirms that winning trades experience larger normal pullbacks during the overlap, a wider trail may be justified.
Again, test first.
The Hidden Cost of a Tight Trail
A tight trail can increase your win rate.
That sounds good.
But do not stop there.
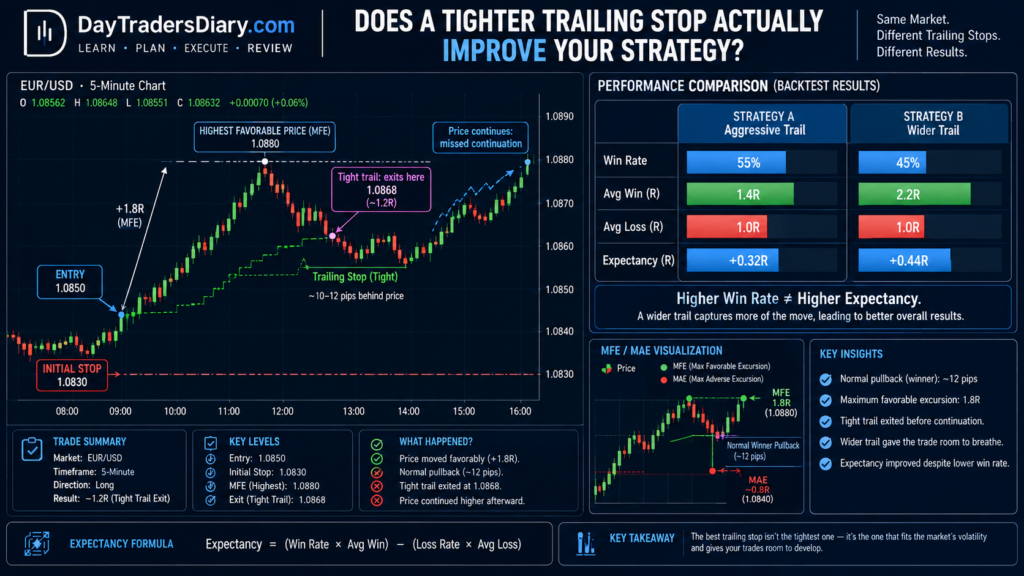
Suppose Strategy A has:
60% win rate.
Average winner = 0.9R.
Average loser = 1R.
Strategy B has:
45% win rate.
Average winner = 2.5R.
Average loser = 1R.
The second strategy may be considerably more profitable despite the lower win rate.
A tight trailing stop might also offer you the psychological sense of improvement because you notice less significant giveback.
But expectancy can suffer if it reduces your average winner a lot.
Measure Expectancy, Not Comfort
The basic equation of expectancy is:
Expectancy = (Win Rate x Avg Win) – (Loss Rate x Avg Loss)
Imagine your first approach wins 45% of the time, with an average winner of 2.2R and an average loser of 1R.
Expectations:
0.45 x 2.2 – 0.55 x 1 = 0.99 – 0.55 = +0.44R
Now add an aggressive trailing stop;
The success rate goes up to 55%.
Average winner falls to 1.4R.
Expectations: –
0.55 x 1.4 – 0.45 x 1 = 0.77 – 0.45 = + 0.32R
Your win rate improved.
Your strategy got worse.
This is why trailing stops should be judged by the entire distribution.
A Trailing Stop Can Change Your Strategy
This point is often overlooked.
Your entry strategy and exit strategy are not independent.
Change the exit, and you change the statistical identity of the strategy.
A breakout strategy with a 3R target is one strategy.
The same breakout strategy with a 0.8R trailing exit can behave like an entirely different system.
Therefore, when you test a trailing stop, you are not simply optimizing an exit.
You are optimizing the complete trading system.
Use R Before Pips When Comparing Different Trades
Pips are useful for execution.
R is useful for comparing trades.
Suppose one trade has a 10-pip initial stop.
Another has a 30-pip initial stop.
A 15-pip trail means very different things to each trade.
But if your trailing distance is 0.75R, the comparison becomes normalized.
This is especially helpful if you trade a lot of different currency pairs.
Example: EUR/USD
1.0850
Initial stop: 1.0830
Risk: 20 pips
Activation: +20pips
Trail: 15 pips
Price at 1.0880.
Trailing stop moved to 1.0865.
Price is at 1.0895.
Trailing stop moved to 1.0880.
Price retreats.
Exit: about 1.0880.
Profit taken: 30 pips.
You had 1.5R.
Example: GBP/USD
Entry: 1.2700
Initial stop: 1.2670
Risk: 30 pips
Activation: +30 pips
Trail: 22.5 pips
Price reaches 1.2760.
Trailing stop moves to approximately 1.2735.
Price reaches 1.2790.
Trailing stop moves to approximately 1.2765.
Price reverses.
Exit: approximately 1.2765.
Profit: 65 pips.
That is about 2.17R.
The pip distances are different.
The risk framework is consistent.
The “Move to Breakeven” Problem
Breakeven is often presented as a universally good idea.
It is not.
Suppose your initial risk is 20 pips.
Price moves +10 pips.
You move the stop to breakeven.
The trade pulls back 12 pips.
You are stopped at the entry.
Then the price rallies 50 pips.
You did not reduce risk.
You converted normal volatility into a scratch trade.
Breakeven should therefore be tested like any other exit rule.
It should not be applied because losing a winner feels uncomfortable.
A Better Breakeven Rule
You could test:
Do not move to breakeven until +1R.
Or:
Do not move to breakeven until the price breaks the next structural level.
Or:
Do not move to breakeven unless the trade has already established a higher low.
The exact rule depends on your strategy.
But it must be defined before the trade becomes emotionally important.
Structure Versus Pip Trailing
This is where pip-based trailing stops have a major limitation.
A market does not know that you are trailing by 15 pips.
Price structure can provide more useful information.
Suppose EUR/USD is trending upward.
Price forms:
Higher high.
Higher low.
Higher high.
Higher low.
A structural trailing method might place the stop beneath the most recent higher low.
A pip-based trail might place it 15 pips below the current price.
Sometimes the structural stop is wider.
Sometimes it is tighter.
The best solution for many discretionary traders is to compare both approaches rather than assuming one is superior.
The Hybrid Structure-Pip Method
A helpful cross might be:
Trailing stop = smaller of the pre-defined structural stop and maximum pip distance permitted
Or, depending upon strategy:
Trailing stop = widest of structural invalidation or volatility low
It is dependent on whether you’re going for maximal protection or trying to avoid early exits which formula is accurate.
As a trend follower I sometimes hate to put the stop inside the regular structural noise, because the pip trail is telling me to do it.
The market structure should be respected.
How To Build Your Own Pip-Based Trailing Stop
Start with your historical trades.
Do not start with a number.
Find the typical initial risk.
Then measure MFE.
Then measure MAE.
Then measure the average retracement experienced by winning trades before continuation.
Then compare those figures across market conditions.
You are looking for the amount of room winners actually need.
Suppose your data shows that winning trades typically retrace:
8 pips during low volatility.
13 pips during normal volatility.
21 pips during high volatility.
Now you have evidence for testing different trailing distances.
You might test:
10 pips.
15 pips.
20 pips.
25 pips.
Then compare the results.
The Optimization Trap
There is a danger here.
If you test 5, 6, 7, 8, 9, 10, 11, 12, 13, 14, and 15 pips, eventually one number will look fantastic.
That does not mean it is robust.
You may have optimized noise.
A better approach is to look for a stable region.
Suppose:
10 pips produces 0.32R expectancy.
15 pips produces 0.39R.
20 pips produces 0.41R.
25 pips produces 0.40R.
That is encouraging.
The exact optimum may be 20 pips, but the broader region around 15 to 25 pips performs similarly.
That is generally more useful than discovering that exactly 18 pips produced the highest historical return.
Out-of-Sample Testing Matters
After finding a candidate trailing method, test it on data that was not used to develop the rule.
Then forward-test it.
DayTradersDiary.com’s guide on how to backtest a day trading strategy recommends comparing backtested performance with live or forward results, including win rate, average R, drawdown profile, and execution quality.
This is especially important for trailing stops because they are path-dependent.
Two trades with the same entry and final price can produce completely different results depending on the route price took between those points.
Journal the Path, Not Just the Result
A typical journal would say:
Long EUR/USD.
Entry: 1.0850
Exit: 1.0880.
Profit: +30 pips
This is not enough to optimize the trailing technique.
You should also note:
First risk.
Level of trailing activation.
Distance behind.
Best pricing.
Maximum pull-back after activation.
Price at each change of trail.
Exit reason
MFE. MAE. Sessions.
Volatility regime.
News condition.
Once you collect enough trades, patterns begin to emerge.
Use the Trade Journal Template
The Trade Journal Template on DayTradersDiary.com is particularly useful here because trailing-stop analysis requires more than recording whether the trade won or lost. The site’s backtesting framework also recommends tagging setup type, market condition, session, execution quality, and emotional state, then comparing live results with backtested results.
You can use the journal to create a specific trailing-stop experiment.
For example, run 30 trades with a 15-pip trail and another 30 with a 20-pip trail.
Do not change entries.
Do not change position size.
Do not change the initial stop.
Change only the trailing rule.
That gives you a cleaner comparison.
Risk Management Comes Before Trading
A trailing stop is not a substitute for proper initial risk.
Your original stop should still represent the point where the trade thesis is invalidated.
Then, the position size should be calculated from that stop.
This is where many traders miscalculate risk. Using the Position Size Calculator helps remove guesswork when the structural stop varies between trades.
If one trade needs a 12-pip stop and another needs 30 pips, your position size should adjust accordingly.
Do not make the stop tighter simply because you want to trade a larger position.
That reverses the correct logic.
The Stop Is a Risk Variable, Not an Entry Variable
Suppose your account risk budget is $100.
Trade A needs a 10-pip stop.
Trade B needs a 25-pip stop.
Your position sizes should differ.
The trader who uses the same lot size on both trades is taking very different monetary risks.
A pip-based trailing stop comes later.
First establish:
Entry.
Invalidation.
Initial risk.
Position size.
Then trade management.
That order matters.
Execution Risk With Stop Orders
There is also a practical issue that many strategy articles ignore.
A stop price is not necessarily a guaranteed execution price.
The SEC explains that when a stop order is triggered, it can become a market order, meaning the actual execution price can differ from the stop price in fast-moving markets. The SEC also notes that short-term price fluctuations can trigger stop orders.
For day traders this is most important during: News releases Market opens Sudden liquidity changes Large gap moves Fast moving instruments Your backtest may presume an exact 15 pip exit. Live execution may not.
This is another reason to avoid optimizing a trailing strategy down to a tiny pip difference.
A 1-Pip Difference Is Usually Not the Edge.
Suppose your backtest says:
18-pip trail = best.
17-pip trail = slightly worse.
19 pip trail = a bit worse.
That doesn’t imply 18 is magic.
Spread.
Slip. Commissions.
Data quality.
Latency of execution.
Market regime
All can drown a very small difference.
Look for strong conduct, not flawless historical accuracy.
A Practical Starting Template
If you are designing a pip-based trailing stop technique from scratch, use this framework:
The first stop is due to structural invalidity.
Activation trailing at 1R
Initial trailing distance is 0.75R to 1R.
Compare that distance to the current short-term ATR.
Do not shorten the tail on the initial natural pullback.
Only tighten once the trade hits a new profit milestone or additional structural confirmation is made.
Then test the entire process across at least several dozen trades.
This is not a universal formula.
It is a sensible research starting point.
When a Fixed Pip Trail Makes Sense
A fixed pip trailing stop is not always wrong.
It can work well when:
The instrument is relatively stable.
The trading session is consistent.
Your setup has predictable volatility.
Your initial risk is relatively uniform.
The strategy has already been tested with that exact exit.
For example, a high-frequency scalping strategy may intentionally use a 5-pip or 8-pip trail because its entire edge is built around short-duration movement.
The key is that the fixed distance belongs to the strategy.
It should not be selected arbitrarily.
When a Fixed Pip Trail Usually Struggles
Fixed trailing distances become more problematic when:
Volatility changes substantially.
You trade multiple instruments.
You trade more than a single session.
You ride through the key headlines.
You have to pull back a lot before you can go on.
Where you start varies a lot.
In these circumstances, R-based or volatility-adjusted trailing approaches are generally worth exploring.
The Psychology of Giving Back Profit
Trailing stops are terrible because they make you watch unrealized profits go.
You see +$200.
Then +160.
$130+ Your brain is screaming: Keep it.
If, however, your system demands a statistical 15 pip decline before you proceed, then locking in too soon is like abandoning your own plan.
This is one of the hardest lessons in trading.
The market is allowed to take back some open profit.
Your job is not to prevent every dollar of giveback.
Your job is to maximize the long-term expectancy of the process.
The Difference Between Protection and Interference
The strategy is covered by a nice trailing stop.
It’s a poor trailing stop that messes it up.
Protection says: “
“I have decided when and how I will cut exposure.”
Interference says:
“I cannot tolerate seeing this profit disappear.”
They can look identical on a chart.
The difference is whether the rule was designed from evidence or emotion.
Scaling and Capital Growth
Once your trailing stop becomes systematic, another problem eventually appears.
You may have a strategy with positive expectancy, controlled drawdowns, and disciplined execution.
But your personal account may still limit the financial impact of that edge.
This is where professional traders sometimes explore external capital models and evaluation programs.
The important point is that an evaluation should be treated as a capital-allocation environment, not a shortcut to wealth.
Your trailing strategy needs to fit the rules.
If your method routinely allows large intraday drawdowns before winners develop, an account with restrictive drawdown rules may be a poor fit.
If your strategy trades around major news, you also need to understand whether the firm’s rules permit that behavior.
For example, the current The5ers High Stakes program lists a 5% maximum daily loss, 10% maximum loss, unlimited maximum trading period, and three minimum profitable days in its current program specifications. It also states that holding overnight and over weekends is allowed, while execution from two minutes before to two minutes after high-impact news is restricted.
Those details matter to a trailing-stop trader.
A strategy that depends on holding through news may behave differently under those rules than it does in a personal account.
Other firms use different evaluation structures and drawdown models. Traders should compare the rules against their actual strategy rather than choosing a firm solely because of advertised account size.
For traders who want to explore the option, The5ers’ evaluation program is worth researching as one potential professional pathway.
The goal should be simple:
Prove the edge first. Then find a capital structure that allows you to apply it without destroying the edge.
Why Capital Should Come After Process
There is little value in putting a $100,000 evaluation account behind a strategy that has never been properly tested.
A trader with a $2,000 account and a validated 0.35R expectancy has something potentially valuable.
A trader with a $100,000 evaluation and an untested trailing stop has a much bigger problem.
Capital amplifies process.
It does not fix the process.
Your Final Trailing Stop Checklist
Before using a pip-based trailing stop strategy live, you should be able to answer five questions.
When does the trail activate?
Why that activation point?
How many pips does it trail?
Why that distance?
How does volatility change the distance?
You should also know what happens when the market reaches 1R, 2R, and 3R.
If the answer is:
“I move the stop when I feel I have enough profit.”
You do not have a trailing strategy yet.
You have a reaction.
Frequently Asked Questions
What is a pip-based trailing stop?
A pip-based trailing stop maintains a predefined distance in pips behind the most favorable price reached after the trailing mechanism becomes active. For a long trade, the stop moves upward as the price makes new highs. For a short trade, it moves downward as the price makes new lows.
What is a good pip-based trailing stop distance?
There’s no number. A good place to start is to test a distance based on beginning risk, say 0.75R to 1R, and compare to current market volatility. The right distance is one that keeps enough winning deals, while keeping undesired giveback in check.
Should I use a fixed pip trailing stop or an ATR trailing stop?
Either is fine. A set pip stop is easy to use and can work well if volatility remains constant ATR trailing adjusts to change in volatility Many traders find that attempting a hybrid method using R-based risk combined with a volatility filter is beneficial.
When should I activate a trailing stop?
Many day traders should test activation at around 1R, not after entering. But breakout, scalping and trend-following tactics may need different activation points . A historical decision it must be.
Should I move my stop to breakeven at 1R?
No. Out of the box. Moving to breakeven at 1R can reduce losses, but can also cause trades to be stopped out on normal pullbacks. Test breakeven independently of your trailing stop rules.
Is a tighter trailing stop better?
Not necessarily. A tighter trail saves more unrealized profit but also can cut down the average amount of a winner. Always compare expectation, average R, drawdown, MFE and MAE instead than just looking at win rate.
Can I use a pip trailing stop for every Forex pair?
You can but the same pip distance could indicate different things across pairs and volatility regimes. If you trade many pairs normalize the rule with R or volatility and test each market on its own.
Does a trailing stop guarantee the exact pip distance?
Nope. The stop price is a trigger, not the actual price at which it is executed. In quick markets execution can be away from the stop price. The SEC particularly advises that stop orders can be filled at prices that are significantly different from the stop price in fast moving markets.
What should I record when testing a trailing stop?
Record initial risk, activation level, trailing distance, MFE, MAE, maximum giveback, exit price, session, volatility regime, setup type, and news conditions. These variables will tell you much more than simply recording whether the trade won or lost.
Final Takeaway
A pip-based trailing stop looks like a simple number.
It is not.
That number controls how much of your strategy’s expected movement you are willing to give the market before deciding the trade is finished.
Set it too tight and you repeatedly sell the exact pullbacks your strategy needs.
Set it too wide, and you may surrender more profit than necessary.
The solution is not to search for the “perfect” pip distance.
Build the number from your data.
Start with the initial risk.
Measure how winners behave.
Measure their normal pullbacks.
Compare the trailing distance with volatility.
Test activation separately from distance.
Then evaluate the entire system through expectancy rather than win rate alone.
Your challenge for the next 30 to 50 trades is simple.
Do not change your entries. Change only your trailing-stop method and record the results.
Compare one fixed pip distance with one R-based or volatility-adjusted alternative.
If the larger trail has fewer exits but much bigger average winners you have learnt something.
If the tighter trail doesn’t kill anticipation, but actually increases risk-adjusted returns, you’ve learnt something else.
Either way, you are no longer guessing.
And that is the real upgrade.
For your next read, revisit how to backtest a day trading strategy on DayTradersDiary.com and use the same research discipline to test your exit rules rather than optimizing only your entries.